AUDUSDAUD/USD is showing strong bullish momentum, breaking key resistance levels with increasing buying pressure. The pair is supported by a weaker USD, improving risk sentiment, and strong commodity prices, particularly in Australia's export sector. Technical indicators suggest further upside potential, with sustained demand and higher lows confirming the bullish trend. A break above recent highs could signal continued gains toward the next resistance zones.
AUDUSD.P trade ideas

AUDUSD Is Bullish! Buy!
Here is our detailed technical review for AUDUSD.
Time Frame: 9h
Current Trend: Bullish
Sentiment: Oversold (based on 7-period RSI)
Forecast: Bullish
The market is approaching a significant support area 0.622.
The underlined horizontal cluster clearly indicates a highly probable bullish movement with target 0.632 level.
P.S
We determine oversold/overbought condition with RSI indicator.
When it drops below 30 - the market is considered to be oversold.
When it bounces above 70 - the market is considered to be overbought.
Like and subscribe and comment my ideas if you enjoy them!

AUDUSD - Trend ReveraslThe pair formed bullish divergence on 1H TF and then give breakout of falling wedge. Entry can be taken at break of new high

AUDUSD: BULLS ARE CONQURING NEW HIGHAfter a bearish spell the RSI showed a bullish divergence. Consequently the pair has also showed the HH and LH. Therefore, we may initiate a long position when it crosses the recent high.
For convenience the SL, TP1 and TP2 has been marked on the chart.
Pl do share your thought about it.

Can we go for a R/R2 Buy Position on AUSUSD?After the big drop seems that it'll have correction to 0.63...
This is only an idea...
Please manage your risk...

AUDUSD sell setupOANDA:AUDUSD
Overall bias is bearish, with the previous Daily candlestick closing below the Daily AOI, currently awaiting a retest to the DAILY AOI around the price of 0.62400 to look for sells with entry signals/confirmation of course


correctionThe upward and fluctuating trend is expected to continue until the specified resistance levels. Then there is a possibility of a trend change.

Heading into 61.8% Fibonacci resistance?The Aussie (AUD/USD) is rising towards the pivot which has been identified as a pullback resistance and could drop to the 1st support.
Pivot: 0.6313
1st Support: 0.6144
1st Resistance: 0.6401
Risk Warning:
Trading Forex and CFDs carries a high level of risk to your capital and you should only trade with money you can afford to lose. Trading Forex and CFDs may not be suitable for all investors, so please ensure that you fully understand the risks involved and seek independent advice if necessary.
Disclaimer:
The above opinions given constitute general market commentary, and do not constitute the opinion or advice of IC Markets or any form of personal or investment advice.
Any opinions, news, research, analyses, prices, other information, or links to third-party sites contained on this website are provided on an "as-is" basis, are intended only to be informative, is not an advice nor a recommendation, nor research, or a record of our trading prices, or an offer of, or solicitation for a transaction in any financial instrument and thus should not be treated as such. The information provided does not involve any specific investment objectives, financial situation and needs of any specific person who may receive it. Please be aware, that past performance is not a reliable indicator of future performance and/or results. Past Performance or Forward-looking scenarios based upon the reasonable beliefs of the third-party provider are not a guarantee of future performance. Actual results may differ materially from those anticipated in forward-looking or past performance statements. IC Markets makes no representation or warranty and assumes no liability as to the accuracy or completeness of the information provided, nor any loss arising from any investment based on a recommendation, forecast or any information supplied by any third-party.

AUD - looks to shortHello traders, please feel free to share your trading ideas, and please give a Boost if you agree with my trading plan. My trading strategy is Price Action, which is the simplest strategy of trading on the price movement. A key part of my discipline is Stop Loss set when opening a trading position, which ensures every trading is risk managed. My 1 to 1 trading training is available, please message. Trade well and good luck!

AUD/USD IS BULLISH .Awaiting for the 3rd phase to complete its falling move then to mitigate thee demand order block to find signs of an upside of change of structure to execute long .
I will see how it goes .
Happy trading.

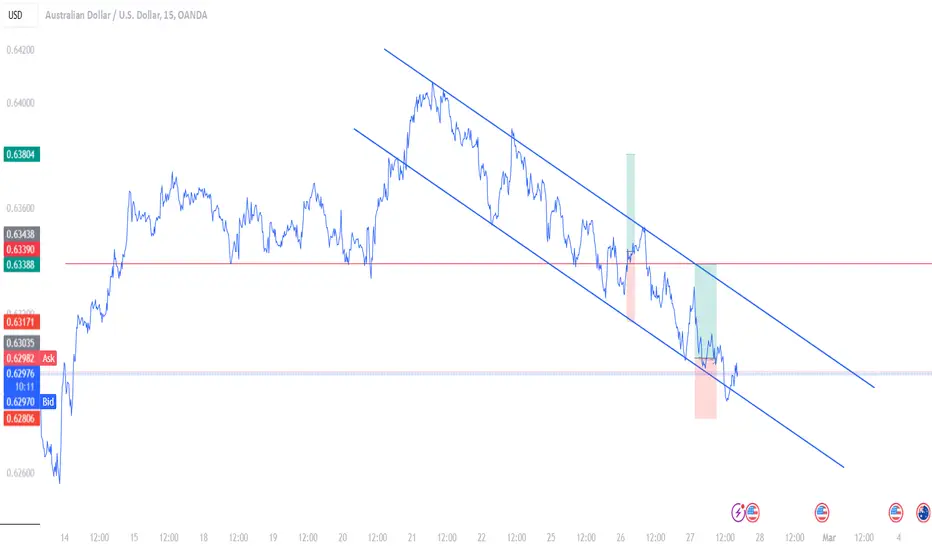
Trade Setup for AUD/USD 1D - 4H - 1HTrade Bias: Bearish
The overall trend across all timeframes is clearly bearish. The daily chart shows a strong downtrend from previous highs of around 0.69, with price currently trading near 0.6203. The 4-hour and 1-hour charts confirm this bearish momentum, with the 1-hour chart showing a recent sharp decline without significant retracement.
Entry Price: 0.6230-0.6240
Looking for a short entry on a pullback to the 0.6230-0.6240 zone, which corresponds to recent support turned resistance levels visible on the 1-hour chart. This area may act as a rejection point within the overall bearish trend.
Stop Loss: 0.6275
Placing the stop loss above the recent swing high visible on the 1-hour chart provides protection while allowing enough room for normal market volatility.
Take Profit Levels:
Take Profit
Primary TP: 0.6160 (recent swing low visible on the 4-hour chart)
Extended TP: 0.6100 (psychological level and also aligns with previous support from the daily chart)
Risk-to-Reward Ratio:
Primary TP: 1:1.75 (35 pips risk, 60-70 pips reward)
Extended TP: 1:3.1 (35 pips risk, 110 pips reward)
Trade Rationale:
The daily chart shows a clear bearish trend with lower highs and lower lows
The current price (0.6203) is testing a potential support level, but the momentum is strongly bearish
No significant reversal patterns are present on any timeframe
Recent price action on the 1-hour chart shows aggressive selling with minimal pullbacks
AUD/USD has been on a significant decline since reaching highs around 0.69, with each rally being sold into
The suggested entry at 0.6230-0.6240 allows for a high-probability trade with a tight stop loss
The overall market structure suggests that sellers remain in control. This setup aims to capitalize on the established downtrend while managing risk appropriately with defined entry, stop-loss, and take-profit levels.
PEPPERSTONE:AUDUSD

audusd long 1 hour chartthis is my audusd long for 1 hour chart it's based on candles and price action. my entry is around 62170 but you can enter higher than that if you like. my stoploss is at 62080 and target profit can be 63000 or 64000 or even 70000.

AUD/USD - Potential TargetsHow I see it:
Key resistance @ 0.62350
LONG, Requires a clear brake above key resistance -
TP 1 = 0.62745
TP 2 = 0.62855
and / or
SHORT, Requires a breach of key support @ 0.61550
TP 1 = 0.60875
Thank you for taking the time to study my analysis.

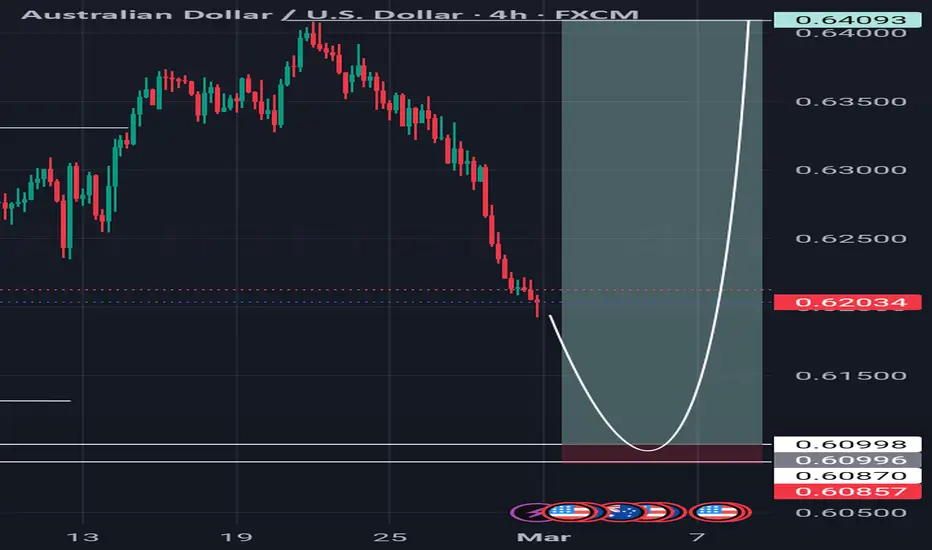
AUDUSD: Bearish Outlook For Next Week Explained 🇦🇺🇺🇸
AUDUSD broke and closed below a significant daily horizontal support on Friday.
It feels like the pair is returning to a global bearish trend.
The market will most likely continue falling.
Next support - 0.61725
❤️Please, support my work with like, thank you!❤️

Institutional traders The order zone below the liquidity is our high probability bullish order block.It causes a CHoCh to the upside and has a liquidity and fair value gap just above it. We expect that the price to come to this zone and continue the uptrend.

AUDUSD: Is There Any Option Other Than Further Decline?In the previous analysis, we mentioned the possibility of further decline for this currency pair, and after touching 0.61, we saw some upward movement. On the daily timeframe, after reaching the supply zone and resistance at 0.64, a renewed decline is now occurring. The expected scenario is a break of the 0.61 support and a drop to the historic 0.60 support level.

Optimistic on AUD for 81-89 centThe Australian dollar has hit a five-year low, but I’m feeling optimistic about OANDA:AUDUSD potentially bottoming out right now. I’d love to see it reach the 81 to 89 cent range within the next couple of years.
This is not a financial advice. This is for entertainment only.

AUDUSD - Fake BreakoutHello Traders !
The AUDUSD failed to break the resistance level (0.63142 - 0.63449).
The higher low is broken (change of character).
So, I expect a bearish move📉
_______________
TARGET: 0.62100🎯

AUDUSD I Weekly CLS, Monthly FVG, Model1 to 50%AUDUSD I Weekly CLS, Monthly FVG, Model1 to 50%
Hey Traders!!
Feel free to share your thoughts, charts, and questions in the comments below—I'm about fostering constructive, positive discussions!
🧩 What is CLS?
CLS represents the "smart money" across all markets. It brings together the capital from the largest investment and central banks, boasting a daily volume of over 6.5 trillion.
✅By understanding how CLS operates—its specific modes and timings—you gain a powerful edge with more precise entries and well-defined targets.
🛡️Follow me and take a closer look at Models 1 and 2.
These models are key to unlocking the market's potential and can guide you toward smarter trading decisions.
📍Remember, no strategy offers a 100%-win rate—trading is a journey of constant learning and improvement. While our approaches often yield strong profits, occasional setbacks are part of the process. Embrace every experience as an opportunity to refine your skills and grow.
Wishing you continued success on your trading journey. May this educational post inspire you to become an even better trader!
“Adapt what is useful, reject what is useless, and add what is specifically your own.”
Dave Hunter ⚔

#035 Trust The Process AUDUSD Buy 1021SGT 26022025Backlog post
Buying. Price at the support level of the down channel, so, I am buying.
2221SGT 26022025
Aussie H4 | Downward momentum accelerating?The Aussie (AUD/USD) is rising towards a pullback resistance and could potentially reverse off this level to drop lower.
Sell entry is at 0.6243 which is a pullback resistance.
Stop loss is at 0.6285 which is a level that sits above a pullback resistance.
Take profit is at 0.6177 which is a multi-swing-low support.
High Risk Investment Warning
Trading Forex/CFDs on margin carries a high level of risk and may not be suitable for all investors. Leverage can work against you.
Stratos Markets Limited (www.fxcm.com):
CFDs are complex instruments and come with a high risk of losing money rapidly due to leverage. 63% of retail investor accounts lose money when trading CFDs with this provider. You should consider whether you understand how CFDs work and whether you can afford to take the high risk of losing your money.
Stratos Europe Ltd (www.fxcm.com):
CFDs are complex instruments and come with a high risk of losing money rapidly due to leverage. 63% of retail investor accounts lose money when trading CFDs with this provider. You should consider whether you understand how CFDs work and whether you can afford to take the high risk of losing your money.
Stratos Trading Pty. Limited (www.fxcm.com):
Trading FX/CFDs carries significant risks. FXCM AU (AFSL 309763), please read the Financial Services Guide, Product Disclosure Statement, Target Market Determination and Terms of Business at www.fxcm.com
Stratos Global LLC (www.fxcm.com):
Losses can exceed deposits.
Please be advised that the information presented on TradingView is provided to FXCM (‘Company’, ‘we’) by a third-party provider (‘TFA Global Pte Ltd’). Please be reminded that you are solely responsible for the trading decisions on your account. There is a very high degree of risk involved in trading. Any information and/or content is intended entirely for research, educational and informational purposes only and does not constitute investment or consultation advice or investment strategy. The information is not tailored to the investment needs of any specific person and therefore does not involve a consideration of any of the investment objectives, financial situation or needs of any viewer that may receive it. Kindly also note that past performance is not a reliable indicator of future results. Actual results may differ materially from those anticipated in forward-looking or past performance statements. We assume no liability as to the accuracy or completeness of any of the information and/or content provided herein and the Company cannot be held responsible for any omission, mistake nor for any loss or damage including without limitation to any loss of profit which may arise from reliance on any information supplied by TFA Global Pte Ltd.
The speaker(s) is neither an employee, agent nor representative of FXCM and is therefore acting independently. The opinions given are their own, constitute general market commentary, and do not constitute the opinion or advice of FXCM or any form of personal or investment advice. FXCM neither endorses nor guarantees offerings of third-party speakers, nor is FXCM responsible for the content, veracity or opinions of third-party speakers, presenters or participants.
