AUDUSDHere's how the anticipated Australian economic data releases may affect the AUD/USD trade directional bias today by 4;30am
Key Data Releases and Potential Impacts:
(1)Cash Rate (Forecast 4.10%, Previous 4.35%):
Lower than Forecast (AUD Negative): If the actual cash rate is lower than the forecast of 4.10%, it would indicate a more dovish stance by the Reserve Bank of Australia (RBA), suggesting concerns about economic growth. This would likely weaken the AUD, leading to a potential decline in the AUD/USD.
As Expected (Neutral to Slightly AUD Negative): If the cash rate matches the forecast of 4.10%, the impact might be neutral, but the AUD could still face some downward pressure because it confirms the RBA is easing monetary policy.
Higher than Forecast (AUD Positive): An unexpected hold or increase in the cash rate would signal a hawkish RBA, strengthening the AUD and potentially leading to an increase in the AUD/USD.
(2)RBA Monetary Policy Statement & RBA Rate Statement:
These statements provide context and reasoning behind the RBA's interest rate decisions and offer insights into the central bank's economic outlook and future policy intentions.
Dovish Statements (AUD Negative): If the statements express concerns about economic growth, highlight downside risks, or signal further rate cuts, the AUD would likely weaken, pushing the AUD/USD lower.
Hawkish Statements (AUD Positive): If the statements convey confidence in the economy, emphasize inflation control, or suggest a willingness to raise rates if needed, the AUD would likely strengthen, potentially leading to an increase in the AUD/USD.
(3)Factors Influencing AUD/USD Directional Bias:
Interest Rate Differentials: The difference between the interest rates set by the RBA and the US Federal Reserve influences the AUD/USD. If the Federal Reserve were to increase the interest rate, money may flow into the US strengthening the US dollar, and consequently weakening the AUD/USD rate.
(4)US Economic Data and Fed Policy: The anticipation is that the Federal Reserve (Fed) will adopt a more cautious stance on cutting interest rates going forward.
(5)China's Economic Conditions: China's weaker-than-expected reports fuel global growth concerns and limit the demand of "risk" currencies like the Aussie.
(6)Commodity Prices: AUD/USD is behaving like a cyclical risk asset, showing relationships with crude oil
Potential Scenarios and Trade Implications:
Dovish RBA, Hawkish Fed: This scenario could create a bearish backdrop for AUD/USD.
Technical Considerations: AUD/USD is finding support from a major area of interest at 0.61451 support,it may see enough demand to revisit the the supply roof aand if it breaks it to the moon,
AUDUSD.P trade ideas

AU ShortPossible sell trade. Sell in the supply zone to buy into the demand zone.
Let's see how it goes!

AUDUSD Wave Analysis – 17 February 2025
- AUDUSD broke the resistance zone
- Likely to rise to resistance level 0.6400
AUDUSD currency pair recently broke the resistance zone between the key resistance level 0.6320 (which stopped the previous minor correction iv) and the 50% Fibonacci correction of the downward impulse from December.
The breakout of this resistance zone accelerated the c-wave of the active ABC correction 2.
AUDUSD currency pair can be expected to rise to the next resistance level 0.6400 (former strong support from April and August of 2024).

AUD/USD: Australian Dollar Strengthens Ahead of RBA DesicionThe Australian dollar has been rising, gaining around 1.5% over the past three sessions against the U.S. dollar. The current bullish movement continues as the market awaits the Reserve Bank of Australia's (RBA) decision in the coming hours. The RBA is expected to cut interest rates by 25 basis points , bringing the new rate to 4.1%.
However, the market has already priced in this decision, as expectations for a rate cut have been consistent for several days. This has allowed upward momentum to persist, as any bearish reaction to the RBA's move may have already been absorbed into the price.
Additionally, as the trade war between the U.S. and China escalates, Australia's economic ties with China have strengthened, boosting confidence in the region and supporting a bullish outlook for the Australian dollar.
Breakout from Sideways Range
Until recently, AUD/USD had been trading within a key range, with resistance at 0.62923 and support at 0.61929. But the recent bullish move has broken through this resistance, leading to stronger buying pressure in the short term.
As long as price remains above the upper boundary of this range, the Australian dollar could maintain its upward momentum in the near term.
RSI Indicator: Overbought Signals?
Not everything is bullish, as the RSI indicator is now approaching 70, the overbought zone.
If the RSI remains above this level for the next few sessions, it could signal an imbalance between buyers and sellers, as well as the potential for short-term selling corrections.
Key Levels to Watch:
0.61929 – Distant Support: Lower boundary of the previous range.
Frequent price oscillations at this level could revive the previous downtrend seen since September 2024.
0.62923 – Key Support: Aligns with the Ichimoku Cloud barrier and the 50-period Simple Moving Average (SMA).
A tentative level where short-term bearish corrections could occur.
0.64323 – Major Resistance: Corresponds to the 38.2% Fibonacci retracement level.
If the bullish bias pushes price toward this level, it could signal the beginning of a stronger uptrend in the short term.
By Julian Pineda, CFA – Market Analyst

Market Insights with Gary Thomson: 17 - 21 FebruaryMarket Insights with Gary Thomson: RBA Rates, UK and Canada’s Inflation, Metals, Earnings Reports
In this video, we’ll explore the key economic events, market trends, and corporate news shaping the financial landscape. Get ready for expert insights into forex, commodities, and stocks to help you navigate the week ahead. Let’s dive in!
In this episode:
- RBA Interest Rate Decision
- Canada’s Inflation Rate
- UK Inflation Rate
- Precious Metals Price Fluctuations
- Corporate Earnings Statements
Don’t miss out—gain insights to stay ahead in your trading journey.
🌐 FXOpen official website: www.fxopen.com
CFDs are complex instruments and come with a high risk of losing your money.

AUDUSD Long1)Trend defined. 4h uptrend.
2)Contradictory limit order entry. At a previous key level after a pullback move.
3)Default loss. Below the 2nd lowest key level.
4)Default target level. 4.71.
5)Risk <= 3%.
6)Singular trade.
7)Trades placed today <= 5.

AUDUSD – Early Focus on the RBA Last week AUDUSD rallied 2% from opening levels around 0.6230 on Monday to a Friday close at 0.6355, as tariff fatigue saw FX traders reduce dollar longs across the board into the weekend.
At the start of this new trading week, the direction of AUDUSD is likely to be determined by local events, with the RBA convening early on Tuesday morning (0330 GMT) to potentially cut interest rates for the first time in nearly 4 years.
Just as relevant could be the tone of comments from RBA Governor Bullock in the press conference, which starts at 0430 GMT.
Given the market is currently pricing in around 75bps of total RBA easing for 2025, her views regarding the pace of future cuts will be important, especially if they shift the market outlook either way in this regard.
Also important will be her comments on inflation, employment and the threat of what a potential trade war between the US and Australia’s most important trading partner China, could mean for Australia’s economy moving forward.
Against this backdrop for potential AUDUSD volatility assessing the technical outlook can also be helpful.
Technical Assessment:
Since the start of February AUDUSD has enjoyed a period of strength that has broken above some of its immediate resistance levels.
This has seen a sustained phase of strength materialise from the February 3rd low at 0.6087, a move that has been able to breach resistance marked by the upper extremes of the downtrend channel which has be in place since it registered a high of 0.6942 on September 30th (see chart above), and which was last touched when a high of 0.6331 traded on January 24th.
While this breakout is no guarantee of continued price strength, it does highlight the potential for further attempts to extend recent upside moves.
What are the Possible Resistance Levels to Watch if Further Upside Strength is Seen?
Fibonacci retracement levels can mark resistance areas where there is potential for sellers to be found again. The 38.2% retracement of the September 30th to February 3rd AUDUSD price weakness stands at 0.6414 and may prove to be a possible level that may cap the current advance.
However, if this wasn’t to be the case and successful closing upside breaks were seen, then the higher 50% retracement point at 0.6515 could well become more relevant.
What Supports Should be Monitored if Prices Reverse Back Lower?
Of course, after what has already been a sustained move higher during February, it’s possible that corrections could materialise ahead of the rate announcement, in response to the decision itself or something that is said in the press conference. If that were to be the case then traders may be watching the 0.6302 level, which is equal to half the rally from last week’s low, as the first support.
While this level holds any price weakness, it’s possible further attempts at upside strength could emerge again, however closing breaks below this level might suggest risks are emerging for a more extended phase of price weakness.
Such moves could in turn point to tests of potential support at 0.6264, which is the 38.2% retracement of February’s price strength and if were to give ways, then the next support which stands at 0.6230 (deeper 50% level on chart above), could become relevant.
The material provided here has not been prepared in accordance with legal requirements designed to promote the independence of investment research and as such is considered to be a marketing communication. Whilst it is not subject to any prohibition on dealing ahead of the dissemination of investment research, we will not seek to take any advantage before providing it to our clients.
Pepperstone doesn’t represent that the material provided here is accurate, current or complete, and therefore shouldn’t be relied upon as such. The information, whether from a third party or not, isn’t to be considered as a recommendation; or an offer to buy or sell; or the solicitation of an offer to buy or sell any security, financial product or instrument; or to participate in any particular trading strategy. It does not take into account readers’ financial situation or investment objectives. We advise any readers of this content to seek their own advice. Without the approval of Pepperstone, reproduction or redistribution of this information isn’t permitted.

#AUDUSD 4HAUDUSD (4H Timeframe) Analysis
Market Structure:
The price is forming an expanding pattern, indicating increased volatility and uncertainty in market direction. Additionally, a sell engulfing candlestick has appeared, suggesting strong bearish momentum and potential downside movement.
Forecast:
A sell opportunity is anticipated as the expanding pattern, combined with the sell engulfing area, signals increased selling pressure.
Key Levels to Watch:
- Entry Zone: A sell position can be considered near the recent resistance area where the sell engulfing pattern has formed.
- Risk Management:
- Stop Loss: Placed above the recent swing high to manage risk.
- Take Profit: Target lower support levels for potential downside movement.
Market Sentiment:
The formation of an expanding pattern with a sell engulfing candlestick suggests that bearish pressure is increasing. Monitoring price action and confirmation signals before entry will help align with the prevailing trend.

sell signal for audusdi see potential base on audusd h4, and then make confirmation on lower timeframe...i plan for sell position with ration 1:5

Buy audusd Here little buy resistance trend line
Just wait to break it then enter into buy with LTF confirmation

EURUSD and AUDUSD Top-down analysis Hello traders, this is a complete multiple timeframe analysis of this pair. We see could find significant trading opportunities as per analysis upon price action confirmation we may take this trade. Smash the like button if you find value in this analysis and drop a comment if you have any questions or let me know which pair to cover in my next analysis.

RBA Poised to Reduce Cash Rate by 25 Basis PointsThe Reserve Bank of Australia (RBA) will meet this Tuesday and is widely anticipated to deliver its first rate cut in four years amid easing inflationary pressures. I am ‘reasonably’ convinced that the central bank will reduce the Cash Rate this week, a belief based on inflation and growth data that delivered prints south of the RBA’s recent projections (released on 5 November 2024).
Following nine consecutive meetings on hold, markets are pricing in a 90% probability that the RBA will reduce the Cash Rate by 25 basis points (bps) to 4.10% from 4.35% (per the ASX 30-Day Interbank Cash Rate futures). Markets are also pricing for an additional 50 bps of cuts by the year-end, lowering the Cash Rate to 3.6%.
I am not holding my breath for anything illuminating to come out of the RBA’s accompanying rate statement and press conference. I believe we will see the Board underscore a cautious tone, echoing the ‘data dependent’ approach. The central bank will likely shine the spotlight on the disinflation progress but stop short of providing anything concrete to signal further cuts.
The RBA will also release their detailed quarterly updated forecasts on growth (GDP ), unemployment, inflation, and the Cash Rate. Traders will look at these metrics closely for any revisions. I expect slightly lower revisions to GDP and inflation, but I do not see much change in forecasts for the Cash Rate.
Inflation and GDP: Main Drivers Behind a Rate Cut
In Q2 24, headline Australian inflation came in lower than expected, decelerating to 2.4% (from 2.8% in Q3 24) and marking the lowest quarterly reading since early 2021. This not only places headline inflation within the lower boundary of the RBA’s inflation target band of 2-3%, but the trimmed mean inflation rate – the RBA’s preferred measure of underlying inflation – also exhibited signs of softness, cooling to within touching distance of the RBA’s upper target band (3.0%) at 3.2% in Q4 24 (year-on-year ) from 3.5% in Q3 24.
GDP cooled to 0.8% in Q3 24 (YY), down from 1.0% in Q2 24 and marked the slowest pace of economic growth since late 2020. Quarterly (Q3 24), GDP grew by 0.3%, following a slight increase of 0.2% in the previous quarter (Q2 24).
However, while inflation is trending in the right direction and growth remains subdued – providing some legroom for the RBA to cut the Cash Rate this week – the central bank’s easing cycle will likely be slow and steady this year. Coupled with underlying inflation trending just north of the RBA’s inflation target, the central bank still faces a reasonably solid jobs market. Employment increased by 56,300, comfortably surpassing the market’s median estimate of 15,000 and was above November’s revised reading of 28,200, and wage growth remains steady.
AUD/USD Shaking Hands with Resistance
The AUD/USD currency pair (Australian dollar versus the US dollar) finished last week locking horns with daily resistance between US$0.6417 and US$0.6364 (this area comprises several ratios , a horizontal resistance level, and an ascending resistance extended from US$0.6170).
What is also interesting is the approach to the above-noted resistance could prompt sellers to enter the fray this week. Following a lower low of US$0.6088 in early February, this likely encouraged breakout selling. With these orders now flushed out of the market (bear trap) and the recent higher high (US$0.6368) potentially exciting buyers, this, coupled with price testing resistance last week, could be a bull trap in the making to push things lower.

uptrendIt is expected that the upward trend will continue until the specified resistance levels are formed. Then, depending on the price behavior in the specified time frame, there will be a possibility of a trend change.

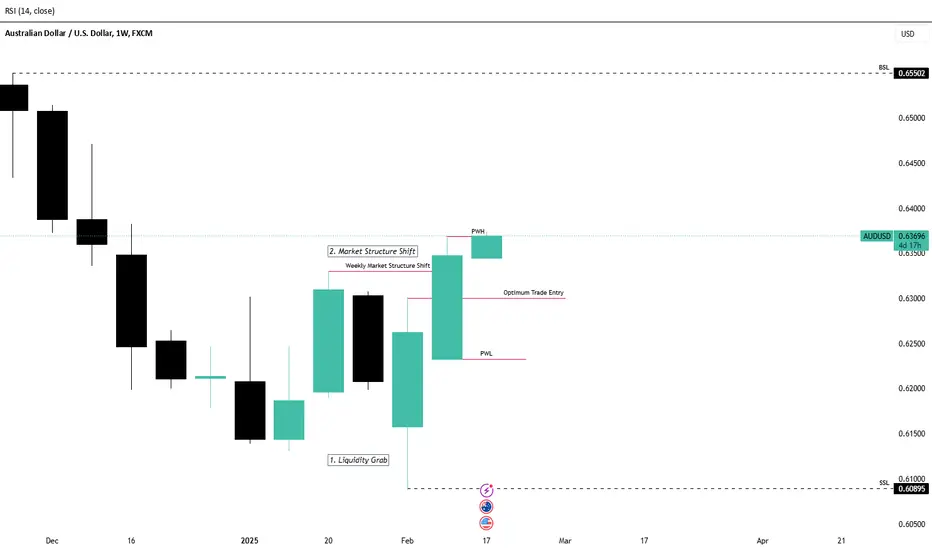
AUDUSD Weekly BiasThis pair is now on a bullish run considering that;
1. We had a liquidity grab at 0.61 Zone.
2. Market Structure Shift at 0.633.
The pair might aim towards the Buyside Liquidity at 0.655 and our entry positions might be around the 0.63 Zone.
AUD/USD - Bullish Intent Locked InMarket’s got the vibe, just waiting for the right pullback to strike.
4H:
Bullish intent is clear, but no IDM sweep or order block mitigation yet. Patience building up the perfect play.
30M:
Structure still holding strong with the bulls. Waiting for IDM liquidity to get swept and that order block to get hit before making my move.
Execution’s coming soon. I’ll let the market show its hand first — then I’m in.
Bless Trading!

AUDUSD Breaking Bullish?Hello traders
It appears that AUDUSD is turning bullish.
We are looking to enter on the retracement to the support zone.
When price comes back to it, wait for a bullish green candle on the 4H and then you can enter on the close of the candle.
Ghost's AUD/USD Setup [LONG/SHORT]I believe at the moment shorts and longs are valid, shorts on the short-term, longs for the long-term no pun intended.
We have an equal low created leaving behind internal liquidity I am expecting to be swept before price can continue higher, 0.617 to me seems to be a strong & critical area of price for the current environment and as such, could be tapped before price continues to .65+.
RBA interest rate decision is around the corner & COT positioning is indicating profit take so be careful gang.
As it stands right now GTFX is on a 22 win streak, almost 300 pips acquired for 2025 already and a lot more to come.


Massive week for Aussie and Kiwi markets The Reserve Bank of Australia’s first meeting of the year is days away with money markets pricing in an 86% chance of a 25bps cut and a 14% chance that rates unchanged.
However, Australia Finacial Review’s John Kehoe suggests market expectations of a 90% probability for a cut may be overstated, arguing the decision is closer to a 50/50 call.
If the RBA cuts rates on Tuesday, it could support the government's message that cost-of-living pressures are easing and could lead to an early election announcement. If rates remain unchanged, the prime minister may delay the election until mid-April or May, hoping for a cut at the RBA’s next meeting on April 1.
Meanwhile, the RBNZ is expected to cut rates this week, with markets pricing a 68% chance of a 50bps cut and a 32% chance of a 25bps reduction. A Reuters poll of 33 economists found 32 expecting a 50bps cut. However, ASB chief economist Nick Tuffley anticipates smaller 25bps cuts in April and May instead.

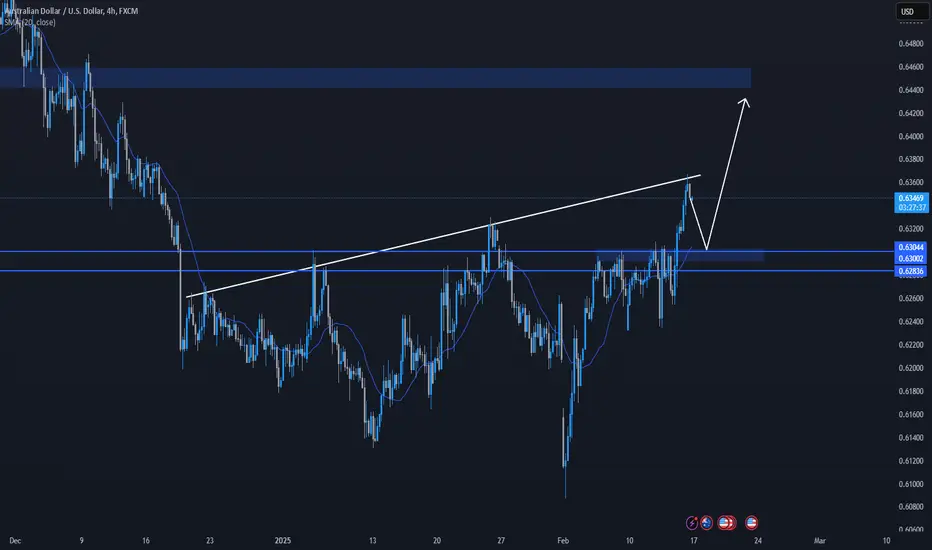
AUDUSD 4hrPrice broke the previous resistance. Possible buy with SL below the new support target for this swing is 0.65400, for more conservative tp 0.65000.
If you're a day trader or shorter term target 0.64000 is also reasonable

AUDUSDFundamental Analysis of AUD/USD (February 2025)
This analysis includes updated macroeconomic indicators, geopolitical factors, data from the Commitment of Traders (COT) report, possible scenarios, and a favorable scenario based on existing economic data.
1. Macroeconomic Indicators and Monetary Policy
Australia
• GDP and Economic Growth:
• The Australian economy has shown modest growth in recent quarters, influenced by global demand for raw materials and economic conditions in China, Australia’s main trading partner.
• Inflation:
• Inflation expectations have risen to 4.6% in February 2025, up from 4.0% in the previous month, marking the highest level in the past 10 months.
• RBA Monetary Policy:
• The Reserve Bank of Australia (RBA) is expected to cut interest rates by 75 basis points during 2025, with the first reduction potentially coming in the upcoming meeting.
• Unemployment and Labor Market:
• The unemployment rate has remained stable at around 4%, supported by job growth and public sector spending.
United States
• GDP and Economic Growth:
• The US economy continues to expand, supported by consumer spending and a strong labor market.
• Inflation:
• Inflation remains above the 2% target set by the Federal Reserve (Fed), prompting the central bank to maintain a restrictive monetary policy.
• Fed Monetary Policy:
• The Fed has kept its benchmark interest rate between 4.25% and 4.50%, reflecting a cautious stance amid inflationary pressures.
• Unemployment and Labor Market:
• The US unemployment rate remains low, indicating a resilient job market.
2. Geopolitical Factors
• US-China Trade Relations:
• The US administration has announced 25% tariffs on steel and aluminum imports, set to take effect on March 12, 2025. These measures could negatively impact the Australian dollar, given Australia’s reliance on commodity exports to China.
• Fiscal Policies:
• The US budget deficit and expansionary fiscal policies may influence the long-term strength of the US dollar.
3. Commitment of Traders (COT) Report - February 11, 2025
Non-Commercial Traders (Large Speculators):
• Long Positions: Data not available
• Short Positions: Data not available
• Net Position: -65,600 (short on AUD)
• This indicates a bearish sentiment among large speculators, who anticipate a depreciation of the Australian dollar.
Commercial Traders (Hedgers):
• Long Positions: Data not available
• Short Positions: Data not available
• Net Position: Data not available
• Without specific data, it is difficult to assess commercial traders’ positioning.
Small Traders (Non-Reportable):
• Long Positions: Data not available
• Short Positions: Data not available
• Net Position: Data not available
• Without precise data, evaluating small traders’ sentiment remains uncertain.
Interpretation:
• Large speculators hold net short positions on the Australian dollar, suggesting expectations of further depreciation.
• Due to the lack of detailed data on commercial and small traders, assessing their positioning remains inconclusive.
4. Possible Scenarios for AUD/USD
Scenario 1: AUD Depreciation (Bearish for AUD/USD)
• Triggers:
• The RBA cuts interest rates.
• Rising trade tensions between the US and China negatively impact Australian exports.
• A slowdown in China’s economy reduces demand for Australian commodities.
• Outcome:
• AUD/USD may drop below 0.64.
Scenario 2: Consolidation (Sideways Movement)
• Triggers:
• Mixed economic data from both countries.
• The Fed and RBA maintain cautious approaches.
• Outcome:
• AUD/USD remains between 0.65 and 0.67.
Scenario 3: AUD Appreciation (Bullish for AUD/USD)
• Triggers:
• The RBA delays or limits rate cuts.
• The US economy shows signs of slowing down, leading to a shift in Fed policy.
• Easing trade tensions between the US and China.
• Outcome:
• AUD/USD may rise above 0.70.
5. Favorable Scenario Based on Current Data
Given macroeconomic data, COT positioning, and geopolitical factors, the medium-term favorable scenario for AUD/USD is one of consolidation, with potential for a moderate AUD recovery.
• Reasons:
• Large speculators are heavily short on the Australian dollar, but potential RBA policy shifts may lead to a reversal.
• The Australian economy remains stable, with inflation slightly higher than expected.
• If the Fed signals a more dovish approach, the US dollar may weaken, supporting AUD/USD.
• Target:
• AUD/USD may test 0.67 - 0.69 in the coming months.
6. Disclaimer
This analysis is for educational purposes only and does not constitute investment advice. The Forex market is volatile, and trading decisions should be based on individual research and analysis. Any losses resulting from the use of this analysis are the sole responsibility of the investor.

AUDUSD TRADE SETUPWait for retest the key level and bullish momentum and confirmation then take a trade for Buy otherwise skip this setup

AUDUSDMinor Bearish outlook to move upwards.
AUDUSD Pair is in a slowing bearish momentum, looking to shift Bullish.
Option 1 or Options 2 , i am leaning to O2 for the following week.
