AUD/USD DTF Time Frame – Technical & Fundamental AnalysisAUD/USD DTF Time Frame – Technical & Fundamental Analysis
Technical Outlook:
On the daily time frame, AUD/USD has been consolidating after a strong bearish move that drove price down to the 0.59000 level. Following this, significant buying pressure led to a breakout above the anticipated major key resistance at 0.63500.
Currently, price action is indicating accumulation above this critical level, confirmed by a bullish engulfing candle. This suggests that buyers may continue to gain momentum in the near term.
However, it’s worth noting that liquidity has not yet formed, which indicates the potential for a liquidity hunt between defined zones. Based on this, our current strategy is:
Buy Limit Order: 0.63080 (within the liquidity zone) to capitalize on the opportunity, aiming for a higher reward with a 1:4 risk-to-reward ratio.
Stop Loss: 0.62560
Take Profit: 0.65230 (next minor key resistance)
Risk-Reward Ratio: 1:4
This setup aligns with the broader bullish structure forming on the daily time frame.
Fundamental Outlook:
Australia’s positive fundamentals are contributing to a bullish outlook for AUD/USD:
Commodity Price Recovery: A significant rebound in global commodity prices, especially for iron ore, coal, and copper, has supported Australia’s key exports, boosting demand for the AUD.
China’s Economic Rebound: As Australia’s largest trading partner, China’s economic recovery—marked by increased industrial output and government stimulus—has led to a surge in export demand, which is also strengthening the Australian dollar.
Domestic Stability in Australia: The Australian economy is showing signs of stabilization, with stronger-than-expected employment data and rising consumer confidence. These developments reduce the likelihood of aggressive rate cuts by the Reserve Bank of Australia (RBA).
On the other hand, the U.S. fundamentals are showing some weakness:
Weaker-than-Expected Unemployment Claims: The latest U.S. Unemployment Claims came in at 222K, higher than the forecast of 215K and previous 215K, indicating a slight softening in the U.S. labor market. This adds further downward pressure on the USD, especially as concerns over economic momentum rise.
Conclusion:
Given the strong bullish technical setup and positive fundamentals for the Australian dollar, combined with the recent weakness in U.S. employment data, the outlook for AUD/USD remains bullish.
📌 Disclaimer:
This is not financial advice. As always, wait for proper confirmation before executing trades. Manage your risk wisely and trade what you see, not what you feel.
AUDUSD.P trade ideas

AUD/USD is Bullish: More Gains AheadFenzoFx—The AUD/USD pair rebounded from the $0.6363 support level, aided by the 50-period simple moving average, and is currently trading near $0.6413.
Resistance stands at $0.6444. A close above this level may extend the bullish move toward $0.6940 and $0.7200.
Bearish Scenario : A drop below $0.6363 would invalidate the bullish outlook, potentially triggering a decline toward $0.6322.

possibility of uptrendThe price is expected to fluctuate within the current support range. Then, with consolidation above the red support range, the continuation of the upward trend is likely.

Bullish engulfing This is good sign to enter, as you can see right now we're on an uptrend on an uptrend we buy on downtrend we sell . Don't forget this is not a financial advice, do your analysis and compare i might be wrong your analysis might right so chess

Breakout and retest Trend inside trend strategy . The trend inside was broken so this more like a scalp but you can re analyze and compare,Don't forget to wait for a proper correction a double bottom on 15 minutes timeframe

AUD/USD broke out above 0.64000, time to reassess the planAUD/USD trade idea – not a position, just a setup to watch 👀
We’re seeing a potential 1H double top forming after a strong bullish leg, supported by a clean rejection candle and my TWT pattern. This could lead to a pullback toward the golden zone of the Fibonacci retracement — which opens up a possible long opportunity in line with the trend.
For short-term traders, there might be a chance to catch a short here if the double top confirms, but it's definitely more aggressive and riskier, as you'd be trading against the broader bullish trend. Watching price action closely from here will be key. Let's see how it plays out.

longMarket correlation shows usd weakness among all the usd pairs higher the chances of market to touch above resistance level,because of higher high and the trending usd weakness

Week of 4/20/25: AUDUSD AnalysisWeekly and daily candles are consecutively bullish with a V-shape recovery to the upside. Looking for longs and especially keeping an eye out for the 1H POI flip-zone that I refined in the 4H POI.
Unless 1H internal structure shifts bearish, I am long ALL THE WAY!
Major News:
PMI - Wednesday
Unemployment - Thursday
Thanks for tuning in, have a great week.

Trading AUDUSD | Judas Swing Strategy 15/04/2025Tuesday's price action on FX:AUDUSD , we got a textbook Judas Swing play and for those still getting used to spotting these setups in real-time, let’s break this one down and talk through what happened and more importantly, why it happened.
Going into the session open, we had a relatively tight consolidation, with the 00:00 - 08:30est range acting as a container for liquidity. Price had built up liquidity at the high and low of the zone. Whichever side gets swept first will determine our directional bias for the session
Just after the session began, we saw price aggressively push up taking out the buy side liquidity resting above those early highs. This is what is called the "Judas move", a false breakout meant to trap breakout buyers and entice liquidity into the market. This move is not random. It’s designed to induce traders into the wrong side of the market before the real direction reveals itself
As soon as that liquidity grab was complete, we noticed price begin to stall and form a shift in market structure. This is critical. Once you see a break of structure to the downside, followed by a lower high into a FVG, that’s your confirmation that the real move, the sell-off is in play. We then saw clean displacement to the downside, confirming the manipulation phase was over
Now we wait for a retracement into the Fair Value Gap (FVG). We'll only look to execute a trade once a candle enters the FVG and closes. After a few minutes of waiting, price finally retraced into the FVG, giving us the green light to execute the trade.
Entry: 0.63749
Stop loss: 0.63849
Take profit: 0.63549
This FX:AUDUSD trade gave us a smooth ride with minimal drawdown. Right after entry price moved swiftly into profit. Although there was a brief retrace back to our entry point, it quickly corrected, and we were back in the green. With just a 1% risk, the trade delivered a solid 2% return all within 1 hour and 20 minutes
This setup is an excellent example of why you don’t want to chase early session breakouts blindly. The Judas Swing strategy teaches us to look for the trap, wait for confirmation, and then trade in alignment with the real intention behind price. Beginners often get caught up in the initial move, thinking it’s the real trend. But if you can slow down, understand the time of day, the draw on liquidity, and the reaction around key highs/lows, you’ll start to see how often price manipulates before delivering.

AUDUSDThe market is currently exhibiting a prevailing downtrend, prompting a focus on identifying potential short-selling opportunities. According to this analysis, a Head and Shoulders (H&S) pattern has formed on the 3-5min chart, presenting a potential bearish entry following a confirmed break below the neckline.
For traders who have entered short positions based on this pattern, there are two potential target levels identified at and , derived by the hourly strong resistance level, the 4 hour downtrend, the previous recent lower low, the overbought RSI, and a few other indicators used.
Conversely, while the primary focus is on sell opportunities due to the overarching downtrend, potential long positions would require more significant confirming signals. These confirmations may include [ a break and close above a key resistance level, bullish divergence on a specific indicator, positive fundamentals and a LOCK.
Further detailed analysis and real-time updates are available just send a message or leave a comment!

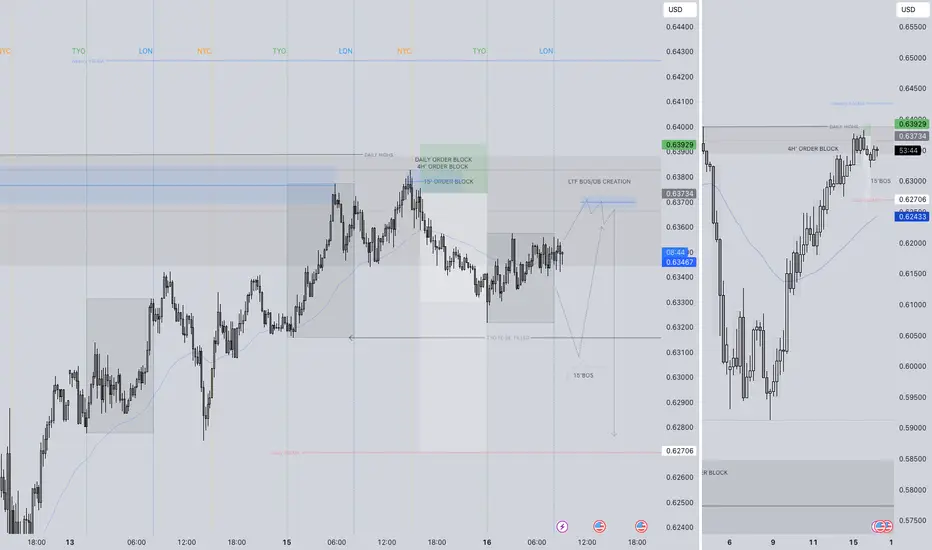
AUDUSD SHORT FORECAST Q2 W16 D16 Y25AUDUSD SHORT FORECAST Q2 W16 D16 Y25
GM.
Here's a short forecast for AUDUSD short based of 4 hour order block.
awaiting short confirmation in turn around in price in turn creating a lower time frame order block to be used to short from.
Let's await price action!
FRGNT X
AUDUSD(20250416)Today's AnalysisMarket news:
U.S. import prices fell 0.1% in March from the previous month, the first month-on-month decline since September last year.
Technical analysis:
Today's buying and selling boundaries:
0.6346
Support and resistance levels:
0.6414
0.6388
0.6372
0.6320
0.6304
0.6278
Trading strategy:
If the price breaks through 0.6346, consider buying, the first target price is 0.6372
If the price breaks through 0.6320, consider selling, the first target price is 0.6304

AUD/USD⚔️ Strategy Options:
🟢 Bullish Tactical Play (Range Swing):
Only valid if price closes weekly above 0.6450.
Entry: Buy limit on retest of 0.6310
SL: 0.6150
TP1: 0.6500
TP2: 0.6850
This is a short-term retracement play against a longer-term bearish trend.
🔴 Bearish Trend Continuation:
Ideal if weekly closes below 0.6200
Entry: Sell retrace at 0.6300
SL: 0.6460
TP1: 0.6000
TP2: 0.5800–0.5650
This aligns with macro pressure (risk-off + China slowdown) and offers clean structure.

AUD/USD is Overbought: Awaiting CorrectionFenzoFx—AUD/USD is in a strong bullish run, nearing the $0.6407 resistance. The Stochastic Oscillator signals overbought conditions, indicating the Australian dollar is overpriced in the short term.
While the trend remains bullish, consolidation may follow, with potential support at $0.6276.
>>> No Deposit Bonus
>>> %100 Deposit Bonus
>>> Forex Analysis Contest
All at F enzo F x Decentralized Forex Broker

AUDUSD SHORT FORECAST Q2 W16 D15 Y25AUDUSD SHORT FORECAST Q2 W16 D15 Y25
Good Morning Traders!
A very similar setup to what was forecast yesterday! Take a look.
We are sitting in varies higher time frame order blocks with confluence stacking.
We have had a move off the point of interest identified yesterday and a 15' order block was created on the bearish move.
Let price action gravitate to our 15' order block in London for a continued short.
FRGNT X

Daily Chart Price Action: AUDUSD Monday 4/14/2025In this video, we are looking at Price Action movement on the Daily Chart. This includes forecasting of upward movement towards .63830 range.

AUDUSD Wave Analysis – 14 April 2025- AUDUSD reversed from the long-term support level 0.5945
- Likely to rise to resistance level 0.6400
AUDUSD currency pair recently reversed up from the support area between the major long-term support level 0.5945 (which started the sharp weekly uptrend in 2020) and the lower weekly Bollinger Band.
The upward reversal from this support area created the weekly Japanese candlesticks reversal pattern Bullish Engulfing – strong buy signal for AUDUSD .
Given the clear bullish divergence on the weekly Stochastic indicator and the strongly bearish US dollar sentiment, AUDUSD currency pair can be expected to rise to the next resistance level 0.6400.

AUD/USD - Potential TargetsDear Fellow Traders,
How I see it:
First "SHORT" then "LONG"
My "BEARISH" targets in case Daily "Trend Resistance" holds -
* TP1 & TP 2 as indicated.
My "BULLISH" targets in case Daily "Trend Resistance" are breached -
* TP1 & TP2 as indicated.
Feel free to ask if anything is unclear.
Thank you for taking the time to study my analysis.

Market Analysis: AUD/USD Gains Pace, Bulls Are Back?Market Analysis: AUD/USD Gains Pace, Bulls Are Back?
AUD/USD started a decent increase above the 0.6150 and 0.6200 levels.
Important Takeaways for AUD USD Analysis Today
- The Aussie Dollar rebounded after forming a base above the 0.6000 level against the US Dollar.
- There is a connecting bullish trend line forming with support at 0.6260 on the hourly chart of AUD/USD at FXOpen.
AUD/USD Technical Analysis
On the hourly chart of AUD/USD at FXOpen, the pair started a fresh increase from the 0.5940 support. The Aussie Dollar was able to clear the 0.6065 resistance to move into a positive zone against the US Dollar.
There was a close above the 0.6200 resistance and the 50-hour simple moving average. Finally, the pair tested the 0.6315 zone. A high was formed near 0.6314 and the pair recently started a consolidation phase.
There was a move below the 0.6300 level. The pair remained above the 23.6% Fib retracement level of the upward move from the 0.5913 swing low to the 0.6314 high.
On the downside, initial support is near the 0.6260 level. There is also a connecting bullish trend line forming with support at 0.6260. The next major support is near the 0.6220 zone. If there is a downside break below the 0.6220 support, the pair could extend its decline toward the 0.6205 level.
Any more losses might signal a move toward 0.6065 and the 61.8% Fib retracement level of the upward move from the 0.5913 swing low to the 0.6314 high.
On the upside, the AUD/USD chart indicates that the pair is now facing resistance near 0.6315. The first major resistance might be 0.6340. An upside break above the 0.6340 resistance might send the pair further higher.
The next major resistance is near the 0.6385 level. Any more gains could clear the path for a move toward the 0.6450 resistance zone.
This article represents the opinion of the Companies operating under the FXOpen brand only. It is not to be construed as an offer, solicitation, or recommendation with respect to products and services provided by the Companies operating under the FXOpen brand, nor is it to be considered financial advice.

Aussie H4 | Potential bullish bounceThe Aussie (AUD/USD) is falling towards a pullback support and could potentially bounce off this level to climb higher.
Buy entry is at 0.6264 which is a pullback support.
Stop loss is at 0.6170 which is a level that lies underneath an overlap support.
Take profit is at 0.6390 which is a multi-swing-high resistance.
High Risk Investment Warning
Trading Forex/CFDs on margin carries a high level of risk and may not be suitable for all investors. Leverage can work against you.
Stratos Markets Limited (tradu.com):
CFDs are complex instruments and come with a high risk of losing money rapidly due to leverage. 63% of retail investor accounts lose money when trading CFDs with this provider. You should consider whether you understand how CFDs work and whether you can afford to take the high risk of losing your money.
Stratos Europe Ltd (tradu.com):
CFDs are complex instruments and come with a high risk of losing money rapidly due to leverage. 63% of retail investor accounts lose money when trading CFDs with this provider. You should consider whether you understand how CFDs work and whether you can afford to take the high risk of losing your money.
Stratos Global LLC (tradu.com):
Losses can exceed deposits.
Please be advised that the information presented on TradingView is provided to Tradu (‘Company’, ‘we’) by a third-party provider (‘TFA Global Pte Ltd’). Please be reminded that you are solely responsible for the trading decisions on your account. There is a very high degree of risk involved in trading. Any information and/or content is intended entirely for research, educational and informational purposes only and does not constitute investment or consultation advice or investment strategy. The information is not tailored to the investment needs of any specific person and therefore does not involve a consideration of any of the investment objectives, financial situation or needs of any viewer that may receive it. Kindly also note that past performance is not a reliable indicator of future results. Actual results may differ materially from those anticipated in forward-looking or past performance statements. We assume no liability as to the accuracy or completeness of any of the information and/or content provided herein and the Company cannot be held responsible for any omission, mistake nor for any loss or damage including without limitation to any loss of profit which may arise from reliance on any information supplied by TFA Global Pte Ltd.
The speaker(s) is neither an employee, agent nor representative of Tradu and is therefore acting independently. The opinions given are their own, constitute general market commentary, and do not constitute the opinion or advice of Tradu or any form of personal or investment advice. Tradu neither endorses nor guarantees offerings of third-party speakers, nor is Tradu responsible for the content, veracity or opinions of third-party speakers, presenters or participants.

AUDUSD(20250414)Today's AnalysisMarket news:
Fed Collins: It is currently expected that the Fed will need to keep interest rates unchanged for a longer period of time. If necessary, the Fed is "absolutely" ready to help stabilize the market; Kashkari: No serious chaos has been seen yet, and the Fed should intervene cautiously only in truly urgent situations; Musallem: The Fed should be wary of continued inflation driven by tariffs.
Technical analysis:
Today's buying and selling boundaries:
0.6256
Support and resistance levels:
0.6374
0.6330
0.6301
0.6210
0.6182
0.6138
Trading strategy:
If the price breaks through 0.6301, consider buying, the first target price is 0.6330
If the price breaks through 0.6256, consider selling, the first target price is 0.6210

Aud/usd tariff trade idealooking to buy Aud/Usd if we get positivity with China and the U.S coming to the trade table and coming to an agreement.
looking for a sell of aud/usd with any escalations when it comes to China and the U.S

AUDUSD Technical and Order Flow AnalysisOur analysis is based on multi-timeframe top-down analysis & fundamental analysis.
Based on our view the price will rise to the monthly level.
DISCLAIMER: This analysis can change anytime without notice and is only for assisting traders in making independent investment decisions. Please note that this is a prediction, and I have no reason to act on it, and neither should you.
Please support our analysis with a like or comment!
