AUDUSD bullish scenarioAUDUSD has been slowly stabilizing. The bearish trend has definitely slowed down. We can say that we see the formation of a triple bottom, from which we could see a move to the bullish side. A break above 0.61000 should be enough of a tailwind for further recovery.
AUDUSD.P trade ideas

AUD/USD TodayChart can't be much cleaner...
working on a 4th top touch
Slight bullish divergence every time it hits top trend line, then falls back to 45-55 range in RSI keeping buyers in control
Setting another new high over the next hour??? Or continuing the trend and heading back down???

AUDUSDAUD/USD is currently forming higher highs and higher lows on the 1-hour timeframe, indicating a strong bullish structure.
We will look to enter a long position at the current market price, with a stop-loss placed at 0.61063.
Our target levels are set at 0.63372 and 0.63859.

AUDUSD – Bullish Trade Setup (1H Short-Term Divergence)✅ Market Snapshot:
Pair: AUDUSD
Timeframe: 1 Hour
Direction: Short-Term Bullish
Signal: Bullish Divergence – Lower lows on price, higher lows on RSI/MACD
Bias: Reversal or retracement likely from recent bearish leg
🔍 Technical Confluence:
Divergence confirms slowing bearish momentum
Price reacting from an intraday support zone or demand area
Candle Structure: Early signs of bullish pressure – e.g. doji, bullish engulfing
📈 Trade Plan – LONG Setup
Entry:
On confirmation candle after divergence
Or breakout of a micro-resistance on 1H timeframe
Stop Loss:
Below the recent swing low (beneath divergence)
Take Profit:
TP1: Previous structure high on 1H
TP2: Near 0.618 Fibonacci retracement of last bearish move
Risk-to-Reward: Aim for 1:1.5 or 1:2
⚠️ Things to Watch:
USD news events that may increase volatility
If price makes another lower low without divergence, setup may weaken
Best paired with a break of trendline or order block confirmation

AUD/USD For bullishwait for pull-back near entry point and then go long
general trend is down trend
current phase is pull-back
have fun :)

Connecting Your Tickmill Account to TradingView: A Step-by-Step In this step-by-step guide, we’ll show you exactly how to connect your Tickmill account to TradingView in just a few seconds.
✅ Easy walkthrough
✅ Real-time trading from charts
✅ Tips for a smooth connection
Don’t forget to like, comment, and subscribe for more trading tutorials!
All Strategies Are Good; If Managed Properly!
~Richard Nasr

Examples of invalid setups | Judas Swing Strategy 07/04/2025As traders, it's crucial to spend time in the lab backtesting your strategy and exploring ways to optimize it for better performance in live markets. You’ll start to notice recurring patterns, some that work in your favor, and others that consistently lead to unnecessary losses. It might take time to spot these patterns and even longer to refine them to fit your trading system, but going through this process is what helps you evolve. In the long run, this is what you need to do to become a better trader.
We spent a considerable amount of time refining our entry technique for the Judas Swing strategy after noticing a recurring issue where entering with a limit order sometimes gets us stopped out on the very same candle. After testing a few alternative entry methods and making some key adjustments, we finally found an approach that worked consistently for us. On Monday, April 7th, 2025, this refinement proved its worth by saving us from two potentially painful losses. In this post, we’ll walk you through exactly what happened and how the improved entry made all the difference.
We got to our trading desks ready to scout for setups and were drawn to promising setups forming on both FX:AUDUSD and $NZDUSD. This was exciting since the previous week offered no solid trading opportunities. As price swept the liquidity resting above the highs of the zone our bias quickly shifted toward potential selling setups for the session. But before taking any trade, we always ensure every item on our entry checklist is met. Here’s what we look for:
1. A break of structure to the sell side
2. The formation of a Fair Value Gap (FVG)
3. A retracement into the FVG
4. Entry only after a confirmed candle close
With the first two requirements on our checklist confirmed, all that remained were the final two and at this stage, patience is key. As price began retracing toward the FVG on both FX:AUDUSD and OANDA:NZDUSD , things got interesting. Price came into the Fair Value Gap on both pairs, checking off the third requirement. Now, all that was left was to wait for the current candle to close.
But that’s where things will be clear to you now.
Had we jumped in early with a limit order, we would’ve been stopped out on the same candle. This moment served as a perfect reminder of why we now wait for a confirmed candle close before taking any trade. It’s this extra step that helps us avoid unnecessary losses and stick to high-quality setups.
This entry technique like any other, comes with its own set of pros and cons. At times a limit order might offer a more favorable entry price compared to waiting for a candle close and that can influence both your stop-loss and take-profit placements. On the flip side, there are also instances where waiting for the candle close gives you a better entry than the limit order would have. That’s why it’s so important to backtest.
Your job as a trader is to put in the time to study and test what works best for your system. We chose this candle close entry method because we did the work. After extensive backtesting and data analysis, we found this approach aligns best with the results we aim for in the long run.

2.59RR Trade on AUD/USDTake this trade if you are a noob.
This should hopefully tap into our zone, we have a sell bias today on AUD/USD.
First TP- Where CHoCH occure
Second TP- End of CHoCH
Third TP- FVG

AUD/USD - Potential TargetsDear Fellow Traders,
CPI - Inflation Data Today, be safe.
1) Potential return - "SHORT" to breakout area if trend resistance holds.
2) Strong bullish breakout yesterday, price can also just attempt a minor correction and
continue to rally - "LONG".
Feel free to ask if anything is unclear.
Thank you for taking the time to study my analysis.

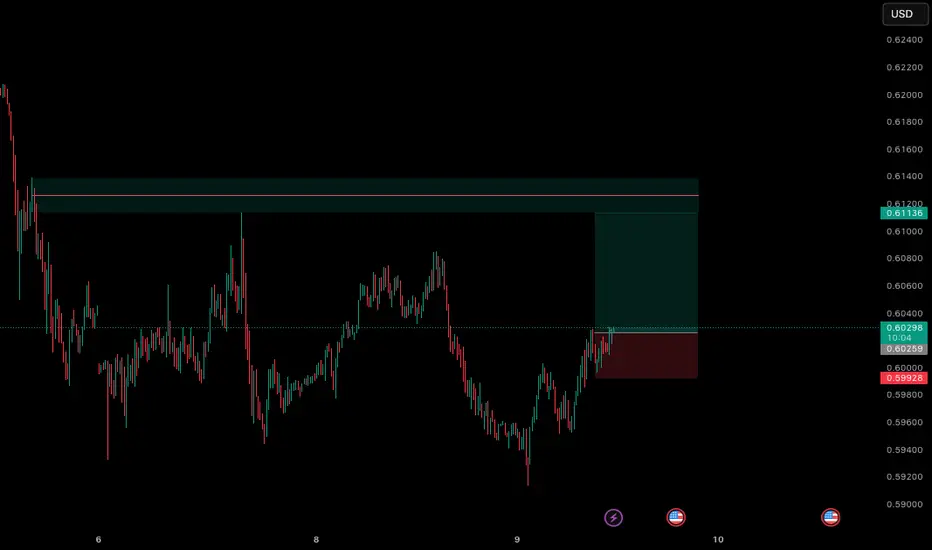
A correction to my previous read of AUDUSDI had to correct my reading of AUDUSD, and taking another look at it, it also makes more sense now.
It had a little more correction to finish, and I believe it has now finished the correction it has been in since '21, and here finished what I call the Z wave.
Now I'm waiting for the pullback into the green box in the area of 0.60588 - 0.60244 where it will finish the second wave.
It might go a little lower to the fiblevel 0.786 but price has no business under 0.59138 level.
Then this count will be invalidated.
If this truly is a new impulse, then after visiting the green box price should go all the way up to minimum of 0.64314 and go into the yellow box area, before it will start the 4th wave correction.
I can't see this as being a A-B-C correction, BUT if it is, price would slow down at the 0.62640 level and eventually end at 0.63220 level. But this is not my favored count.
You are welcome to give me your thoughts on this.

AUDUSD The liq has swept
price is almost gonna hit Daily supply zone
waiting for drawn structure once happen then .
going to short it.

Falling Wedge Trading Pattern: Unique Features and Trading RulesFalling Wedge Trading Pattern: Unique Features and Trading Rules
Various chart patterns give an indication of possible market direction. A falling wedge is one such formation that indicates a possible bullish reversal. This FXOpen article will help you understand whether the falling wedge pattern is bullish or bearish, what its formation signifies about the market direction, and how it can be used to spot trading opportunities.
What Is a Falling Wedge Pattern?
Also known as the descending wedge, the falling wedge technical analysis chart pattern is a bullish formation that typically occurs in the downtrend and signals a trend reversal. It forms when an asset's price drops, but the range of price movements starts to get narrower. As the formation contracts towards the end, the buyers completely absorb the selling pressure and consolidate their energy before beginning to push the market higher. A falling wedge pattern means the end of a market correction and an upside reversal.
How Can You Spot a Falling Wedge on a Price Chart?
This pattern is usually spotted in a downtrend, which would indicate a possible bullish reversal. However, it may appear in an uptrend and signal a trend continuation after a market correction. Either way, the falling wedge provides bullish signals. The descending formation generally has the following features.
- Price Action. The price trades lower, forming lower highs and lower lows.
- Trendlines. Traders draw two trendlines. One connects the lower highs, and the other connects the lower lows. Finally, they intersect towards a convergence point. Each line should connect at least two points. However, the greater the number, the higher the chance of the market reversal.
- Contraction. The contraction in the price range signals decreasing volatility in the market. As the formation matures, new lows contract as the selling pressure decreases. Thus, the lower trendline acts as support, and the price consolidating within the narrowing range creates a coiled spring effect, finally leading to a sharp move on the upside. The price breaks through the upper trendline resistance, indicating that sellers are losing control and buyers are gaining momentum, resulting in an upward move.
- Volume. The trading volume ideally decreases as the pattern forms, and the buying volume increases with the breakout above the upper trendline, reflecting a shift in momentum towards the buyers.
Falling and Rising Wedge: Differences
There are two types of wedge formation – rising (ascending) and falling (descending).
An ascending wedge occurs when the highs and lows rise, while a descending wedge pattern has lower highs and lows. In an ascending formation, the slope of the lows is steeper and converges with the upper trendline at some point, while in a descending formation, the slope of the highs is steeper and converges with the support trendline at some point.
Usually, a rising wedge indicates that sellers are taking control, resulting in a downside breakdown. Conversely, a descending wedge pattern indicates that buyers are gaining momentum after consolidation, generally resulting in an upside breakout.
The Falling Wedge: Trading Rules
Trading the falling wedge involves waiting for the price to break above the upper line, typically considered a bullish reversal. The pattern’s conformity increases when it is combined with other technical indicators.
- Entry
According to theory, the ideal entry point is after the price has broken above the wedge’s upper boundary, indicating a potential upside reversal. Furthermore, this descending wedge breakout should be accompanied by an increase in trading volume to confirm the validity of the signal.
The price may retest the resistance level before continuing its upward movement, providing another opportunity to enter a long position. However, the entry point should be based on the traders' risk management plan and trading strategy.
- Take Profit
It is essential to determine an appropriate target level. Traders typically set a profit target by measuring the height of the widest part of the formation and adding it to the breakout point. Another approach some traders use is to look for significant resistance levels above the breakout point, such as previous swing highs.
- Stop Loss
Traders typically place their stop-loss orders just below the lower boundary of the wedge. Also, the stop-loss level can be based on technical or psychological support levels, such as previous swing lows. In addition, the stop-loss level should be set according to the trader's risk tolerance and overall trading strategy.
Trading Example
In the chart above, there is a falling wedge. A trader opened a buy position on the close of the breakout candlestick. A stop loss was placed below the wedge’s lower boundary, while the take-profit target was equal to the pattern’s widest part.
Falling Wedge and Other Patterns
Here are chart patterns that can be confused with a falling wedge.
Falling Wedge vs Bullish Flag
These are two distinct chart formations used to identify potential buying opportunities in the market, but there are some differences between the two.
A descending wedge is a bullish setup, forming in a downtrend. It is characterised by two converging trendlines that slope downward, signalling decreasing selling pressure. A breakout above the upper trendline suggests a bullish move.
A bullish flag appears after a strong upward movement and forms a rectangular shape with parallel trendlines that slope slightly downward or move sideways. This formation represents a brief consolidation before the market resumes its upward trajectory.
While the falling wedge indicates a potential shift in a downtrend, the bullish flag suggests a continuation of an uptrend.
Falling Wedge vs Bearish Pennant
The falling wedge features two converging trendlines that slope downward, indicating decreasing selling pressure and often signalling a bullish reversal when the price breaks above the upper trendline.
Conversely, the bearish pennant forms after a significant downward movement and is characterised by converging trendlines that create a small symmetrical triangle. This pattern represents a consolidation phase before the market continues its downward trend upon breaking below the lower trendline.
While the falling wedge suggests a potential bullish move, the bearish pennant indicates a continuation of the bearish trend.
Falling Wedge vs Descending Triangle
The falling wedge consists of two downward-sloping converging trendlines, indicating decreasing selling pressure and often signalling a bullish reversal when the price breaks above the upper trendline. In contrast, the descending triangle features a flat lower trendline and a downward-sloping upper trendline, suggesting a buildup of selling pressure and typically signalling a bearish continuation when the price breaks below the flat lower trendline.
While the falling wedge is associated with a potential bullish move, the descending triangle generally indicates a bearish trend.
Falling Wedge: Advantages and Limitations
Like any technical pattern, the falling wedge has both limitations and advantages.
Advantages
- High Probability of a Reversal. The falling wedge is often seen as a strong, bullish signal, especially when it occurs after a downtrend. It suggests that selling pressure is subsiding, and a reversal to the upside may be imminent.
- Clear Entry and Exit Points. The pattern provides clear points for entering and exiting trades. Traders often enter when the price breaks out above the upper trendline and set stop-loss orders below a recent low within the formation.
- Versatility. The wedge can be used in various market conditions. It is effective in both continuation and reversal scenarios, though it is more commonly associated with bullish reversals.
- Widely Recognised. Since the falling wedge is a well-known formation, it is often self-fulfilling to some extent, as many traders recognise and act on it, further driving the market.
Limitations
- False Breakouts. Like many chart patterns, the falling wedge is prone to false breakouts. Prices may briefly move above the resistance line but then fall back below, trapping traders.
- Dependence on Market Context. The effectiveness of the falling wedge can vary depending on broader market conditions. In a strong downtrend, it might fail to result in a significant reversal.
- Requires Confirmation. The wedge should be confirmed with other technical indicators or analysis tools, such as volumes or moving averages, to increase the likelihood of an effective trade. Relying solely on the falling wedge can be risky.
- Limited Use in Low-Volatility Markets. In markets with low volatility, the falling wedge may not be as reliable, as price movements might not be strong enough to confirm the falling wedge's breakout.
The Bottom Line
The falling wedge is a powerful chart pattern that can offer valuable insights into potential trend reversals or continuations, depending on its context within the broader market. By understanding and effectively utilising the falling wedge in your strategy, you can enhance your ability to identify many trading opportunities. As with all trading tools, combining it with a comprehensive trading plan and proper risk management is crucial.
FAQ
Is a Falling Wedge Bullish?
Yes, the falling wedge is a bullish continuation pattern in an uptrend, and it acts as a bullish reversal formation in a bearish market.
What Does a Falling Wedge Pattern Indicate?
It indicates that the buyers are absorbing the selling pressure, which is reflected in the narrower price range and finally results in an upside breakout.
What Is the Falling Wedge Pattern Rule?
The falling wedge is a technical analysis formation that occurs when the price forms lower highs and lower lows within converging trendlines, sloping downward. Its rule is that a breakout above the upper trendline signals a potential reversal to the upside, often indicating the end of a downtrend or the continuation of a strong uptrend.
How to Trade Descending Wedge Patterns?
To trade descending wedges, traders first identify them by ensuring that the price is making lower highs and lows within converging trendlines. Then, they wait for the price to break out above the upper trendline, ideally accompanied by increased trading volume, which confirms the breakout. After the breakout, a common approach is to enter a long position, aiming to take advantage of the anticipated upward movement.
What Is the Target of the Descending Wedge Pattern?
The target for a descending wedge is typically set by measuring the maximum width of the wedge at its widest part and projecting that distance upwards from the breakout point. This projection gives a potential price target.
What Is the Entry Point for a Falling Wedge?
The entry point for a falling wedge is ideally just after the breakout above the upper trendline. Some traders prefer to wait for a retest of the broken trendline, which may act as a new support level, before entering a trade to confirm the breakout.
*Important: At FXOpen UK, Cryptocurrency trading via CFDs is only available to our Professional clients. They are not available for trading by Retail clients. To find out more information about how this may affect you, please get in touch with our team.
This article represents the opinion of the Companies operating under the FXOpen brand only. It is not to be construed as an offer, solicitation, or recommendation with respect to products and services provided by the Companies operating under the FXOpen brand, nor is it to be considered financial advice.

AUDUSD – H4 Technical SetupFollowing yesterday’s bullish momentum—sparked in part by Trump’s speech—AUDUSD rallied up to a previous lower low (LL) at 0.61926. This level now acts as a potential resistance zone.
As price approaches this key area, the current H4 candle close will be crucial. If we see a strong rejection from 0.61926, this could set up a short opportunity, in line with the broader bearish trend structure.
📌 What to Watch:
Price reaction at 0.61926 (previous LL)
H4 candle close: bullish continuation or bearish rejection?
Confirmation of rejection (e.g., wick + bearish engulfing) for a potential short entry
⚠️ Reminder: These are my personal views only – not financial advice (NFA). Trade safe.

AUDUSD(20250410)Today's AnalysisToday's buying and selling boundaries:
0.6079
Support and resistance levels:
0.6339
0.6242
0.6179
0.5980
0.5917
0.5820
Trading strategy:
If the price breaks through 0.6179, consider buying, the first target price is 0.6242
If the price breaks through 0.6079, consider selling, the first target price is 0.5980


Could the Aussie reverse from here?The price is rising towards the resistance level which is a pullback resistance that lines up with the 61.8% Fibonacci retracement and could reverse from this level to our take profit.
Entry: 0.6206
Why we like it:
There is a pullback resistance level that aligns with the 61.8% Fibonacci retracement.
Stop loss: 0.6321
Why we like it:
There is a pullback resistance level.
Take profit: 0.6067
Why we like it:
There is a pullback support level.
Enjoying your TradingView experience? Review us!
Please be advised that the information presented on TradingView is provided to Vantage (‘Vantage Global Limited’, ‘we’) by a third-party provider (‘Everest Fortune Group’). Please be reminded that you are solely responsible for the trading decisions on your account. There is a very high degree of risk involved in trading. Any information and/or content is intended entirely for research, educational and informational purposes only and does not constitute investment or consultation advice or investment strategy. The information is not tailored to the investment needs of any specific person and therefore does not involve a consideration of any of the investment objectives, financial situation or needs of any viewer that may receive it. Kindly also note that past performance is not a reliable indicator of future results. Actual results may differ materially from those anticipated in forward-looking or past performance statements. We assume no liability as to the accuracy or completeness of any of the information and/or content provided herein and the Company cannot be held responsible for any omission, mistake nor for any loss or damage including without limitation to any loss of profit which may arise from reliance on any information supplied by Everest Fortune Group.

AUD/USD For Bullishyou can go long now
or
wait for pull-back near entry point and then go long
General trend is down trend
current phase is pull-back
have fun :)

Shorting AUDaily chart showing bearishness
4h chart showing potential internal to external range move.
Lower time frame manipulation with SMT. Entry above midnight open

AUD/USD Bearish Trade Setup – Trendline Rejection & SBR Zone📉 Trendline & Market Structure
🔵 Downward trendline connects lower highs (🔴🔴🔴), showing a bearish trend.
🔵 Price is forming lower highs and lower lows, confirming the downtrend.
🟦 SBR Zone (Support Became Resistance)
🔵 SBR Zone (🟦) was previously a support but now acts as resistance.
🔵 Price is testing this area → Possible rejection and move down.
📌 Trade Setup
✅ Entry: Short (Sell) near SBR zone if rejection occurs.
❌ Stop Loss: 0.60650 (🔺 Above SBR Zone)
🎯 Target Point: 0.59150 (🔻 Downside goal)
📉 Potential Drop: -2.08% (-125.4 pips)
📊 Confirmation Checklist
✔️ Price must reject 🟦 SBR Zone.
✔️ Bearish candles like Pin Bars or Engulfing confirm entry.
✔️ DEMA (9) at 0.60175 → If price drops below, trade is valid.
⚠️ Risk Management
🚀 Good Risk-to-Reward Ratio → Worth considering if rejection occurs.
🔄 Invalidation: If price breaks above 0.60650, setup is canceled.

AUDUSD – Trading Into Key Zones | Testing a New ApproachI'm currently bearish on AUDUSD, based on the overall market structure and price flow. But instead of jumping in at any supply zone, I’m testing a new approach — waiting for the price to trade into my zones before looking for setups. Here's the breakdown:
🧩 New Concept I’m Exploring: “Trading Into Zones”
Rather than reacting too early, I want to align with the natural breathing flow of the market, which often moves:
🔄 From internal range liquidity → to external range liquidity,
and vice versa.
This means price often sweeps liquidity within a range before reaching key levels or zones (external liquidity), and that’s exactly where high-probability trades happen.
AUD/USD - Potential TargetsDear Fellow Traders,
This pair is testing a key confluence of support.
A Falling Channel - Exhaustion Pattern is unfolding.
A strong breakout required above dashed resistance for bullish reversal -
Institutional "LONG" Inventory accumulation is evident.
Feel free to ask if anything is unclear.
Thank you for taking the time to study my analysis.

Aussie H1 | Rising into a multi-swing-high resistanceThe Aussie (AUD/USD) is rising towards a multi-swing-high resistance and could potentially reverse off this level to drop lower.
Sell entry is at 0.6079 which is a multi-swing-high resistance that aligns close to the 38.2% Fibonacci retracement.
Stop loss is at 0.6140 which is a level that sits above the 127.2% Fibonacci extension and a swing-high resistance.
Take profit is at 0.5944 which is a multi-swing-low support.
High Risk Investment Warning
Trading Forex/CFDs on margin carries a high level of risk and may not be suitable for all investors. Leverage can work against you.
Stratos Markets Limited (tradu.com):
CFDs are complex instruments and come with a high risk of losing money rapidly due to leverage. 63% of retail investor accounts lose money when trading CFDs with this provider. You should consider whether you understand how CFDs work and whether you can afford to take the high risk of losing your money.
Stratos Europe Ltd (tradu.com):
CFDs are complex instruments and come with a high risk of losing money rapidly due to leverage. 63% of retail investor accounts lose money when trading CFDs with this provider. You should consider whether you understand how CFDs work and whether you can afford to take the high risk of losing your money.
Stratos Global LLC (tradu.com):
Losses can exceed deposits.
Please be advised that the information presented on TradingView is provided to Tradu (‘Company’, ‘we’) by a third-party provider (‘TFA Global Pte Ltd’). Please be reminded that you are solely responsible for the trading decisions on your account. There is a very high degree of risk involved in trading. Any information and/or content is intended entirely for research, educational and informational purposes only and does not constitute investment or consultation advice or investment strategy. The information is not tailored to the investment needs of any specific person and therefore does not involve a consideration of any of the investment objectives, financial situation or needs of any viewer that may receive it. Kindly also note that past performance is not a reliable indicator of future results. Actual results may differ materially from those anticipated in forward-looking or past performance statements. We assume no liability as to the accuracy or completeness of any of the information and/or content provided herein and the Company cannot be held responsible for any omission, mistake nor for any loss or damage including without limitation to any loss of profit which may arise from reliance on any information supplied by TFA Global Pte Ltd.
The speaker(s) is neither an employee, agent nor representative of Tradu and is therefore acting independently. The opinions given are their own, constitute general market commentary, and do not constitute the opinion or advice of Tradu or any form of personal or investment advice. Tradu neither endorses nor guarantees offerings of third-party speakers, nor is Tradu responsible for the content, veracity or opinions of third-party speakers, presenters or participants.

AUDUSD Double Bottom PatternFenzoFx—AUD/USD formed a double bottom pattern with the immediate support at $0.5932. From a technical perspective, a new consolidation phase toward $0.6085 resistance is imminent if the price holds above the support.
Conversely, the bullish outlook should be invalidated if bears push the AUD/USD prices below the $0.5932 support. If this scenario unfolds, the downtrend will be triggered, targeting $0.5850.
>>> Trade Forex with Low spread, and No swap at FenzoFx
