Travala: Classic Simple Signals & 625% Profits Potential Here is a list of classic, simple (bullish) signals:
Higher lows.
Break above EMA55 daily.
Bullish RSI (Above 50).
Marketwide bullish recovery.
Strong Bitcoin (Above 80K).
» These signals are pointing toward a bullish wave of 625% in the short- to mid-term. Within 1-3 months.
Did you really think you had to wait 8 months?
Not really, the action will start much faster; now it starts.
Maximum bullish momentum all across the Cryptocurrency within a month.
Strong bullish action will be present within days.
Thank you for reading.
Namaste.
AVABTC trade ideas

Critical Levels for AVABTC: Don't Miss These Signals - Traval...◳◱ On the BINANCE:AVABTC chart, the Trend Reversal pattern suggests indications that the trend may be gaining or losing strength. Traders might observe resistance around 0.0000091 | 0.00000998 | 0.00001223 and support near 0.00000685 | 0.00000548 | 0.00000323. Entering trades at 0.00002291 could be strategic, aiming for the next resistance level.
◰◲ General Information :
▣ Name: Travala.com
▣ Rank: 508
▣ Exchanges: Binance, Kucoin, Hitbtc
▣ Category / Sector: Payments - Payment Platforms
▣ Overview: None
◰◲ Technical Metrics :
▣ Current Price: 0.00002291 ₿
▣ 24H Volume: 62.175 ₿
▣ 24H Change: -22.654%
▣ Weekly Change: 195.55%%
▣ Monthly Change: 406.27%%
▣ Quarterly Change: 338.79%%
◲◰ Pivot Points :
▣ Resistance Level: 0.0000091 | 0.00000998 | 0.00001223
▣ Support Level: 0.00000685 | 0.00000548 | 0.00000323
◱◳ Indicator Recommendations :
▣ Oscillators: SELL
▣ Moving Averages: STRONG_BUY
◰◲ Summary of Technical Indicators : BUY
◲◰ Sharpe Ratios :
▣ Last 30 Days: 4.31
▣ Last 90 Days: 2.39
▣ Last Year: 1.17
▣ Last 3 Years: 0.55
◲◰ Volatility Analysis :
▣ Last 30 Days: 8.75
▣ Last 90 Days: 5.22
▣ Last Year: 2.70
▣ Last 3 Years: 1.75
◳◰ Market Sentiment :
▣ News Sentiment: N/A
▣ Twitter Sentiment: N/A
▣ Reddit Sentiment: N/A
▣ In-depth BINANCE:AVABTC analysis available at TradingView TA Page
▣ Your thoughts matter! What do you think of this analysis? Share your insights in the comments below. Your like, follow, and support are greatly valued and help sustain high-quality content.
◲ Disclaimer : Disclaimer
The content provided is for informational purposes only and does not constitute financial, investment, or trading advice. Always conduct your own research and consult a qualified professional before making any financial decisions. Use of the information is solely at your own risk.
▣ Explore the Power of Charting with TradingView
Unlock a wide range of financial analysis tools, data, and features to elevate your trading experience. Take a tour and see the possibilities. If you decide to upgrade your plan, you can receive up to $30 back. Discover more here - affiliate link -

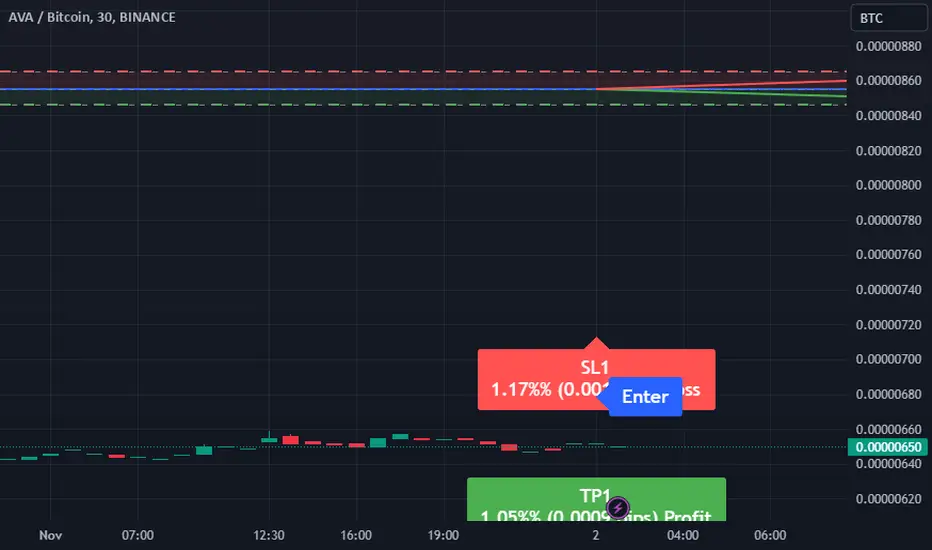
Trading Signal: AVABTC Pair Movement PredictionDear Traders,
We have identified a promising trading opportunity for the AVABTC currency pair. Based on our analysis utilizing the EASY Quantum Ai strategy, we recommend a Buy position.
Enter Price: 6.31E-06
Take Profit: 6.45E-06
Stop Loss: 6.15E-06
Justification for Prediction:
The decision to initiate a Buy position was derived from a comprehensive analysis of recent market trends and indicators. Our EASY Quantum Ai strategy has signaled an upward momentum based on the convergence of several technical indicators such as moving averages, RSI levels, and volume spikes. Historical data demonstrates an upward trend in similar setups, which reinforces our confidence in the predicted movement.
Furthermore, macroeconomic factors, including current market sentiment and the overall stability of the cryptocurrency market, suggest a potential bullish period for AVABTC. This is likely influenced by emerging developments within the Avalanche technology and positive news coverage, which have historically impacted its value positively.
Please ensure you adjust your risk management strategies and stay informed about any market changes that may arise.
Happy Trading!

AVABTC Trading Signal: Sell OpportunityDear Traders,
Our analysis, conducted using the EASY Quantum Ai strategy, indicates a selling opportunity for the AVABTC pair. Below, we present the details of this trade setup:
- Direction: Sell
- Enter Price: 8.55E-06
- Take Profit: 8.46E-06
- Stop Loss: 8.65E-06
Analysis Justification:
Our strategy suggests this market movement based on several critical factors:
1. Technical Indicators: The EASY Quantum Ai strategy has detected a pattern of resistance at the current levels, with clear signs of declining momentum. This is suggesting an impending downward trend for AVABTC.
2. Market Sentiment: Current market sentiment shows increased bearishness in the cryptocurrency sector, leading to potential pressure on AVABTC pairs as traders seek reserve in more stable assets.
3. Volume Analysis: Recent volume indicators show a decreasing buying volume, suggesting the likelihood of fewer buyers willing to keep prices at higher levels.
4. Global Economic Indicators: Broader uncertainties in global markets might influence the selling pressure on digital assets, including AVA, driving the currency pair lower.
We recommend carefully placing your positions considering these parameters, ensuring to adhere strictly to the stop loss and take profit points mentioned.
Wishing you successful trading!
AVA BTC - TravalaWelcome Travala to the cycle lows.
Accumulation advised here.
First target is 0.00002244 - flip this and 0.00003432 is next
Easy x2 at minimum.
RSI showing bullish divergence on high time frame.
Looks even better on the USD pair.
Pray next macro bubble creates fresh highs...

Travala (AVA) Next targetsAVA vs Bitcoin : Same thing here, AVA is trading at a resistance line with Bitcoin,
the price it looks even better with the USD pair.
The fundamentals behind this coin, it travelling.
Well we have a full season ahead of us in this regard.

Travala Grew 4,743% In 2019-20 | Cryptocurrency Goes MainstreamThe 4,743% bullish wave by Travala between 2019 and 2022 lasted a nice 356 days.
The bull-run phase alone lasted about 6 months.
Imagine how such action would look and feel like today, with Bitcoin currently at 50,000+?
➖ If AVABTC produces a relatively weak wave, it would grow around 250%.
This the Altcoins do on a weekend.
➖ A mild wave can produce 675% easy.
Hundreds of pairs, literally, have grown more than this in the past 12 months.
➖ A strong wave can go beyond 1,400%.
Much higher is possible.
I've seen many pairs growing 2,000%, 3,000%, 5,000% and more. Including big projects such as Injective, just to mention one.
Loom Network grew more than 1,000% on its BTC pairing and this happened in the recover year, 2023.
This year can bring something that we are just not ready for.
Something that will stay in our memories for years and years to come.
The year that Cryptocurrency went mainstream will be remembered as 2025 and 2024 .
Namaste.

✳️ Travala | Potential Bottom CatchThis looks like a pair that hit bottom and is getting ready to move up. AVABTC hit its lowest price in more than 3 years, 3 years and 3 months to be exact.
The RSI is oversold and slowly starting to recover.
If this doesn't recover, the risk is ultra-low, the potential is huge.
Good catch.
Namaste.

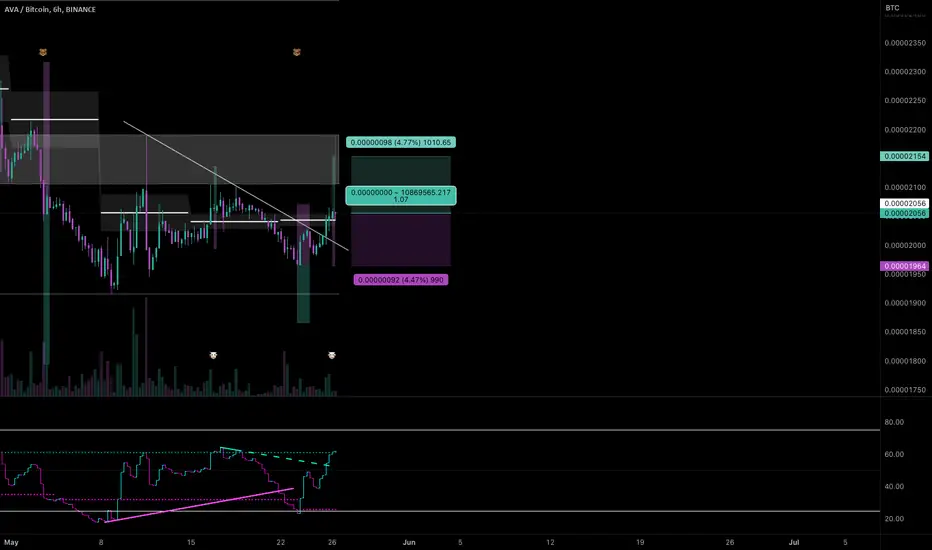
#AVA/BTC - Long - Potential 4.7%Direction: Long
Market: Spot
Risk: 0.25% - 1%
#BTC_AVA
Exchange: BINANCE
Timeframe: 360
TP1: 0.00002154
Entry: 0.00002056
STOP: 0.00001964
Entry Conditions:
| Trendbreak
| CDV trend & resistance break
$AVA - 270% possibly Reclaim white line and keep going till red and blue ..
been a while looks ready to wake up stoch cross
bought a bag will hold for a few days and put stop at entry assuming we are flipping this white line
by then
anything over 40% would be happy to hop off with a 25% moon bag for above targets

$AVA/#BTC [#Travala.com]: Resistance_Breakout◳◱ A Resistance Breakout has been identified on the $AVA / $BTC chart. The price has broken above a key resistance level, indicating a potential bullish trend. The next resistance key levels are located at 0.00003164 | 0.00003322 | 0.00003696, and the major support zones can be found at 0.0000279 | 0.00002574 | 0.000022. Consider entering at the current price zone of 0.00003314 and targeting higher levels.
◰◲ General info :
▣ Name: Travala.com
▣ Rank: 433
▣ Category/Sector: Payments - Payment Platforms
▣ Overview: I'm wokring to include a short Background details for this project.
◰◲ Technical Metrics :
▣ Mrkt Price: 0.00003314 ₿
▣ 24HVol: 5.334 ₿
▣ 24H Chng: 2.347%
▣ 7-Days Chng: 5.39%
▣ 1-Month Chng: 16.45%
▣ 3-Months Chng: 33.25%
◲◰ Pivot Points - Levels :
◥ Resistance: 0.00003164 | 0.00003322 | 0.00003696
◢ Support: 0.0000279 | 0.00002574 | 0.000022
◱◳ Indicators recommendation :
▣ Oscillators: SELL
▣ Moving Averages: STRONG_BUY
◰◲ Technical Indicators Summary : BUY
◲◰ Sharpe Ratios :
▣ Last 30D: 4.07
▣ Last 90D: 2.09
▣ Last 1-Y: 0.34
▣ Last 3-Y: 1.05
◲◰ Volatility :
▣ Last 30D: 0.86
▣ Last 90D: 0.69
▣ Last 1-Y: 1.17
▣ Last 3-Y: 1.37
◳◰ Market Sentiment Index :
▣ News sentiment score is N/A
▣ Twitter sentiment score is 0.75 - Bullish
▣ Reddit sentiment score is 0.76 - Very Bullish
▣ In-depth AVABTC technical analysis on Tradingview TA page
▣ What do you think of this analysis? Share your insights and let's discuss in the comments below. Your like, follow and support would be greatly appreciated!
◲ Disclaimer
Please note that the information and publications provided are for informational purposes only and should not be construed as financial, investment, trading, or any other type of advice or recommendation. We encourage you to conduct your own research and consult with a qualified professional before making any financial decisions. The use of the information provided is solely at your own risk.
▣ Welcome to the home of charting big: TradingView
Benefit from a ton of financial analysis features, instruments and data. Have a look around, and if you do choose to go with an upgraded plan, you'll get up to $30.
Discover it here - affiliate link -

$AVA/#BTC [#Travala com]: Resistance_Breakout◳◱ Hey traders, we've identified a Resistance Breakout on the $AVA / $BTC chart. The price has broken above a key resistance level, which can indicate a potential bullish trend. Taking in consideration the next resistance key levels are at 0.00003164 | 0.00003322 | 0.00003696 and the major support zones are respectively at 0.0000279 | 0.00002574 | 0.000022. It is a bullish indication and we may consider entering at the current price zone at 0.0000332 and targetting higher levels.
◰◲ Technical Metrics :
▣ Mrkt Price: 0.0000332 ₿
▣ 24HVol: 9.446 ₿
▣ 24hChng: 7.097%
◲◰ Pivot Points - Levels :
◥ Resistance: 0.00003164 | 0.00003322 | 0.00003696
◢ Support: 0.0000279 | 0.00002574 | 0.000022
◱◳ Indicators recommendation :
▣ Oscillators: SELL
▣ Moving Averages: STRONG_BUY
◰◲ Technical Indicators Summary : BUY
◳◰ Market Sentiment Index :
▣ News sentiment score is N/A
▣ Twitter sentiment score is 0.75 - Bullish
▣ Reddit sentiment score is 0.76 - Very Bullish
▣ In-depth AVABTC technical analysis on Tradingview TA page
▣ What do you think of this analysis? Share your insights and let's discuss in the comments below. Your like, follow and support would be greatly appreciated!
◲ Disclaimer
Please note that the information and publications provided are for informational purposes only and should not be construed as financial, investment, trading, or any other type of advice or recommendation. We encourage you to conduct your own research and consult with a qualified professional before making any financial decisions. The use of the information provided is solely at your own risk.
▣ Welcome to the home of charting big: TradingView
Benefit from a ton of financial analysis features, instruments and data. Have a look around, and if you do choose to go with an upgraded plan, you'll get up to $30.
Discover it here - affiliate link -

$AVA-HTFbecome an ava whale for booking your holidays at a discount later on ..
most likely we get a devaition below the white line followed by a quick reclaim
IF corn does go to 11500ish then we get the red line to bid for now holding the white line

#avabtc #avausd #ava $ava #elliottwave update buy setup.This count is based on my assumptions so anything can happen not a trading or financial advice just for educational purposes only kindly do your own ta thanks trade with care good luck.

Travala.com (AVA) formed bullish Gartley for upto 18.50% pumpHi dear friends, hope you are well, and welcome to the new update on Travala.com (AVA) token with BTC pair.
On 18th July, I shared the below trade plan for AVA which is still in play:
Now, this idea is the continuation and follow-up of the aforementioned trade setup, as now on the 4-hr time frame, AVA has formed another bullish Gartley pattern, therefore, now we can follow the below buy and sell targets:
The big pump is still possible, but I would suggest that you can follow the above targets and soon switch to the new trade.
Note: Above idea is for educational purpose only. It is advised to diversify and strictly follow the stop loss, and don't get stuck with trade

Travala.com (AVA) formed bullish BAT for upto 74% moveHi dear friends, hope you are well and welcome to the new update on Travala.com (AVA) token with BTC pair.
Previously we had a nice trade of AVA:
On a 2-hr time frame, AVA has formed bullish BAT pattern.
Note: Above idea is for educational purpose only. It is advised to diversify and strictly follow the stop loss, and don't get stuck with trade

Travala Trade Signal (100% Potential Profits)Here I am sharing with you our trade signal for Travala.
As usual, wait patiently for the trade to develop.
It can go up just as it can go down.
We have LOW RISK, with HIGH POTENTIAL for REWARDS.
----
AVABTC
ENTRY: 0.00002150 - 0.00002400
TP1: 0.00002630
TP2: 0.00003050
TP3: 0.00003350
TP4: 0.00003750
TP5: 0.00004250
TP6: 0.00004800
STOP: Close Daily (D) candle below 0.00002000.
----
This is not financial advice.
I am wishing you great profits.
Lots of health, wealth and success.
Now & always!
Namaste.

AVA TRAVALA.COM Expected move | back into channel soon avabtcAVA TRAVALA.COM Expected move | back into channel soon avabtc avausdt

AVAX_BTC 4H, (30_Dec)Hi, Wellcome
We can open a Nice order here, You just need to open the Trade At the Retest not just after the Breakout.
Because confirmation is necessary rather than losing money.
So just follow the mentioned
Open Order Price
TP Price
SL price
Note: please keep in mind that if any bad news happens regarding this Coin then you should need to work promptly.


$AVA Bottom Notification!Weekly
Holding Support which was newly created 6th December
Plus sitting on SuperTrend, if Breaks there will be more downside! But Holding strong.
I like it.


AVA/BTC buy opportunityHi followers,
AVABTC formed a really nice trading setup, buyers came back to play right above the support area.
Followed by higher highs and breakout above previous swing high, which also a breakout from the trendline.
Potential reversal and new up trend forming.
Don't forget to manage your risk! 👌
Good luck and trade with care 🙏
If you like my content - 👍 Like, 💬 comment, 👆 follow and 👉 share!
❗❗❗
Disclaimer: This information is not a recommendation to BUY or SELL. It is to be used for educational purposes only!
Hidden divergence
TA with FradkinXBT | Trading & Investing
