Solana fractal on AXS. Will it repeat?Just having an experiment since chart looking pretty similar. Crazy thoughts tho, if AXS able to replicate Solana move, it might hit $15 the next few weeks. Probably 30-40$ in a few months. Just my crazy thoughts. #nfa #dyor
AXSUSDT.PS trade ideas

AXSUSDTThe signal was much earlier. As a result of the signal, the price rose by 44% and then corrected. But the targets remained, all targets based on Fibonacci levels. Long-term signal, purchases only on SPOT

AXE/USDTHello guys
Considering the completion of the correction of AXS, if the price does not go below the blue range, there are two possible targets:
Tp1 : 19
Tp2: 28
If you have any questions, you can write it in comments below, and I will answer them.
And please don't forget to support this idea with your like and comment.
always make your analysis before a trade
it is not offer to trade.
good luck

AXS IS A KINGAXS correction diametric has been completed for some time. Now the price should enter a medium-term bullish phase.
By maintaining the green range, Flip can move towards the targets
Closing a daily candle below the invalidation level will violate the analysis.
For risk management, please don't forget stop loss and capital management
When we reach the first target, save some profit and then change the stop to entry
Comment if you have any questions
Thank You

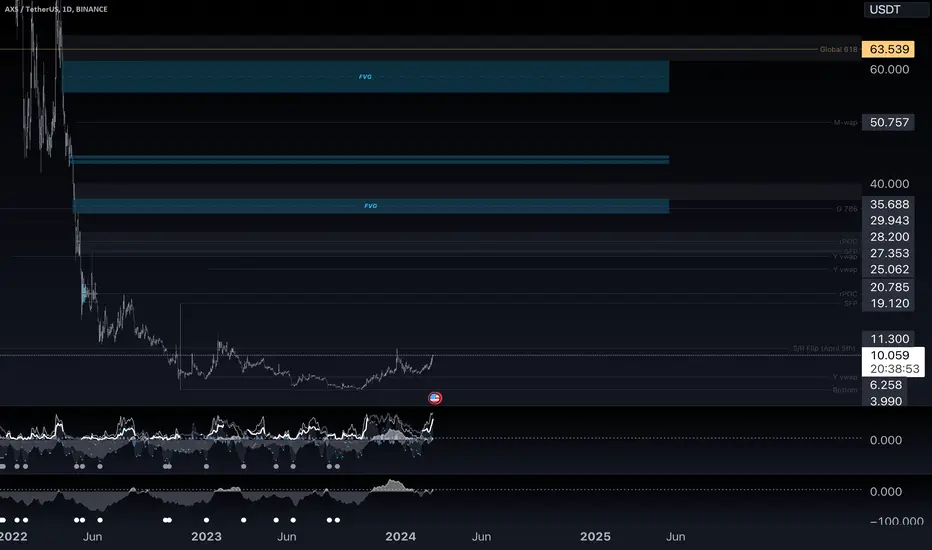
AXS Daily Timeframe Key LevelsLevels on the chart include
-Yearly Vwap snap points
-Monthly Vwap snap points
-Global 618
-Global 786
-Range Points of Control
-Order Blocks
-Fair Value Gaps (Imbalances)
Notice the FVG's close to the orderblocks.
Price gravitates to these levels.
The moneyflow is curving up and increasing.
We have been in the bottom of the bear market.
AXSUSDTmy entry on this trade idea is taken from a point of interest BELOW an inducement.. I extended my stoploss area to cover for the whole swing as price can target the liquidity there before going as i anticipate.. just a trade idea, not financial advise

AXS: Approaching SupportTrade setup : Price is in an Uptrend. Following a bullish breakout from a Descending Triangle pattern, price rallied +20% to $8.50 before pulling back on some profit taking. If it pulls back near $7.00, that could be another attractive swing trade entry in Uptrend. Stop Loss (SL) at $6.70, just below prior swing low.
Trend : Uptrend across all time horizons (Short- Medium- and Long-Term).
Momentum is Bullish but inflecting. MACD Line is above MACD Signal Line and RSI is above 55 but momentum may have peaked since MACD Histogram bars are declining, which suggests that momentum is weakening.
Support and Resistance : Nearest Support Zone is $7.00 (previous resistance), then $6.00. The nearest Resistance Zone is $9.50, then $11.00.

AXSUSDT BUYMade a purchase at the spot. Goals on the chart. I will fix it in parts.
#AXS #AXSBUY #BUY
More ideas me tekegram.

AXS longAXS is bouncing off the support area which is also matching with the Fibonacci 0.382 retracement level. Bullish trend is expected to continue up to 8.55.

AXSUSDTmy entry on this trade idea is taken from a point of interest BELOW an inducement.. I extended my stoploss area to cover for the whole swing as price can target the liquidity there before going as i anticipate.. just a trade idea, not financial advise

AXS: Approaching SupportTrade setup : Price is in an Uptrend. Following a bullish breakout from a Descending Triangle pattern, price rallied +20% to $8.50 before pulling back on some profit taking. If it pulls back near $7.00, that could be another attractive swing trade entry in Uptrend. Stop Loss (SL) at $6.70, just below prior swing low.
Trend : Uptrend across all time horizons (Short- Medium- and Long-Term).
Momentum is Bullish but inflecting. MACD Line is above MACD Signal Line and RSI is above 55 but momentum may have peaked since MACD Histogram bars are declining, which suggests that momentum is weakening.
Support and Resistance : Nearest Support Zone is $7.00 (previous resistance), then $6.00. The nearest Resistance Zone is $9.50, then $11.00.

Breakout - Target:11$1. Supertrend positiv
2. positiv accumulation
3. positiv squeeze
Targets marked with dotted lines in chart

AXS: Descending Triangle BreakoutTrade setup : Trends are mixed. Bullish breakout from a Descending Triangle pattern could see price revisit $8.00 near-term and $9.50 medium-term. Stop Loss (SL) at $6.70, just below prior swing low.
Trend : Uptrend across all time horizons (Short- Medium- and Long-Term).
Momentum is Bullish (MACD Line is above MACD Signal Line and RSI is above 55).
Support and Resistance : Nearest Support Zone is $7.00 (previous resistance), then $6.00. The nearest Resistance Zone is $9.50, then $11.00.


AXS LONGAgain, fill the order in incremental order to get very safe long built in the uncertain BTC zone

AXS Don't Miss Out! Grab the Bull by the Horns and Invest Smart## AXS Coin: Fundamentals, Recent News, and Disclaimer
**Disclaimer:** I am not a financial advisor and this information should not be considered financial advice. Please do your own research before making any investment decisions.
**Fundamentals:**
* **Name:** Axie Infinity (AXS)
* **Type:** ERC-20 token
* **Platform:** Ethereum (with Ronin sidechain)
* **Use case:** Governance token for the Axie Infinity game, used for breeding Axies, staking, and participating in the Axie Infinity DAO.
* **Total supply:** 270 million AXS (capped)
* **Circulating supply:** 137.2 million AXS (as of February 12, 2024)
* **Current price:** $7.69 USD (as of February 12, 2024)
* **Market cap:** $1.05 billion USD (as of February 12, 2024)
**Recent News:**
* **Axie Infinity: Origins launched:** A revamped version of the original Axie Infinity game with improved graphics and gameplay.
* **$150 million funding round:** Sky Mavis, the team behind Axie Infinity, raised $150 million in a funding round led by Andreessen Horowitz (a16z).
* **AXS listed on Coinbase:** AXS was listed on the major cryptocurrency exchange Coinbase in October 2023.
* **Continued growth of Axie Infinity ecosystem:** The number of daily active users on the Axie Infinity platform has continued to grow in recent months.
**Additional Notes:**
* The Axie Infinity game has been criticized for its high entry barrier (requiring the purchase of Axies, which can be expensive), and for its potential links to gambling.
* The crypto market is volatile and the price of AXS could fluctuate significantly in the future.
I hope this information is helpful. Please remember to do your own research before making any investment decisions.

AXS/USDT | 1W 👀I'm buying AXS. The coin has corrected very well, a very attractive price to buy. I'm waiting for the goal according to the plans
Axie Infinity is a platform that allows you to earn tokens and contribute to the ecosystem in a gaming format. Externally, it's a cartoonish game about fantastic creatures, but essentially, it's a social platform and a working network that utilizes NFTs
- Not financial advice, trade with caution.
✅ Stay updated on market news and developments that may influence the price of AxieInfinity. Positive or negative news can significantly impact the cryptocurrency's value.
✅ Exercise patience and discipline when executing your trading plan. Avoid making impulsive decisions driven by emotions, and adhere to your strategy even during periods of market volatility.
✅ Remember that trading always involves risk, and there are no guarantees of profit. Conduct thorough research, analyze market conditions, and be prepared for various scenarios. Trade only with funds you can afford to lose and avoid excessive risk-taking.
#Crypto #AxieInfinity #Investment #AXS

AVAXUSDTAXSUSDT is forming higher highs and higher lows, and there is also the Fibonacci level at 0.78. It might be indicating a long position.

AXS: Descending Triangle BreakoutTrade setup : Trends are mixed. Bullish breakout from a Descending Triangle pattern could see price revisit $8.00 near-term and $9.50 medium-term. Stop Loss (SL) at $6.70, just below prior swing low.
Trend : Downtrend on Short- and Medium-Term basis and Uptrend on Long-Term basis.
Momentum is Mixed as MACD Line is above MACD Signal Line (Bullish) but RSI ~ 50 (Neutral).
Support and Resistance : Nearest Support Zone is $7.00 (previous resistance), then $6.00. The nearest Resistance Zone is $9.50, then $11.00.

AXS/USDT Bullish Surge from support Zone? 👀🚀 AXS Analysis💎 Paradisers, it's time to focus on #AXS as it unfolds an intriguing pattern, perfectly positioned at a support zone and hinting at an imminent bullish rise.
💎 Over at #AxieInfinity, the game is respecting the support level of $6.52. If #AXS can keep up its momentum at this key juncture, we're looking forward to an energetic surge, setting our sights on surpassing the forthcoming major supply zone.
💎 However, should #AXS falter at the $6.52 support, savvy traders should be on the lookout for a potential bullish bounce from a secondary support at $5.53. Be warned, dropping beneath this level might be a precursor to a more pronounced downward trend.

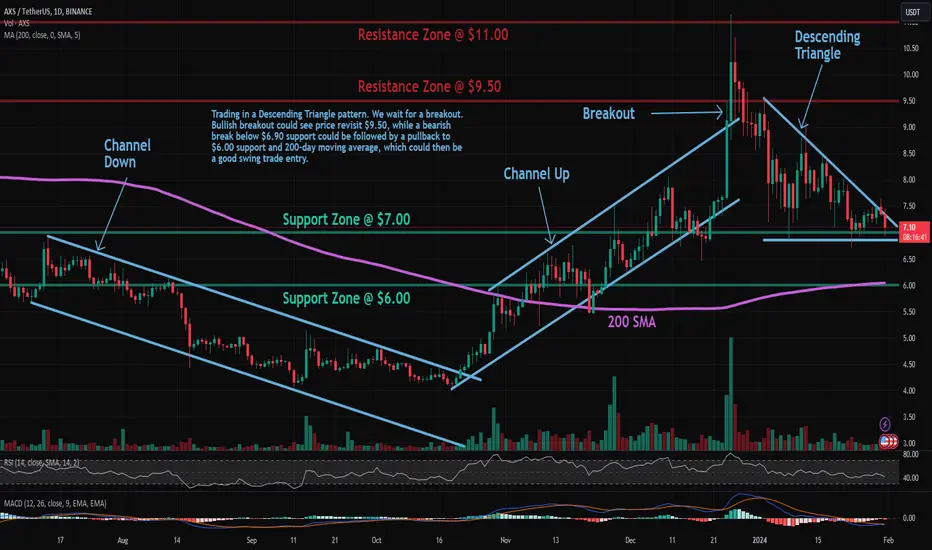
AXS: Descending TriangleTrade setup : Trends are mixed. Trading in a Descending Triangle pattern. We wait for a breakout. Bullish breakout could see price revisit $9.50, while a bearish break below $6.90 support could be followed by a pullback to $6.00 support and 200-day moving average, which could then be a good swing trade entry.
Pattern : Price is trading in a Descending Triangle pattern. Typically, a breakout will occur in the direction of the existing trend. Most traders will take a position once the price action breaks through the bottom line of the triangle with increased volume, which is when the price should decline an amount equivalent to the widest section of the triangle.
Trend : Downtrend on Short-Term basis, Neutral on Medium-Term basis and Uptrend on Long-Term basis.
Momentum is Bearish but inflecting. MACD Line is below MACD Signal Line and RSI is below 45 but momentum may have bottomed since MACD Histogram bars are rising, which suggests that momentum could be nearing another upswing.
Support and Resistance : Nearest Support Zone is $7.00 (previous resistance), then $6.00. The nearest Resistance Zone is $9.50, then $11.00.

AXS Initiated an Upward TrendAXS initiated an upward trend after successfully breaking through the downtrend's resistance level. This upward movement persisted until it reached the resistance area, marked by the orange zone, where a price correction subsequently occurred. The resumption of price growth is anticipated if bullish patterns appear. On the daily timeframe, the blue box serves as a crucial support level. A breach of this support could lead to a downward trend in the daily timeframe.

AXS: Descending TriangleTrade setup : Trends are mixed. Trading in a Descending Triangle pattern. We wait for a breakout. Bullish breakout could see price revisit $9.50, while a bearish break below $6.90 support could be followed by a pullback to $6.00 support and 200-day moving average, which could then be a good swing trade entry.
Pattern : Price is trading in a Descending Triangle pattern. Typically, a breakout will occur in the direction of the existing trend. Most traders will take a position once the price action breaks through the bottom line of the triangle with increased volume, which is when the price should decline an amount equivalent to the widest section of the triangle.
Trend : Neutral on Short- and Medium-Term basis and Uptrend on Long-Term basis.
Momentum is Bearish but inflecting. MACD Line is below MACD Signal Line and RSI is below 45 but momentum may have bottomed since MACD Histogram bars are rising, which suggests that momentum could be nearing another upswing.
Support and Resistance : Nearest Support Zone is $7.00 (previous resistance), then $6.00. The nearest Resistance Zone is $9.50, then $11.00.