B3 Aanalysis (12H)The strong bullish move on B3 is turning into a 3D. It could move from the supply zone towards the SWAP zone and then get rejected upwards.
We are looking for buy/long positions in the green zone. Targets are marked on the chart.
A daily candle close below the invalidation level will invalidate th

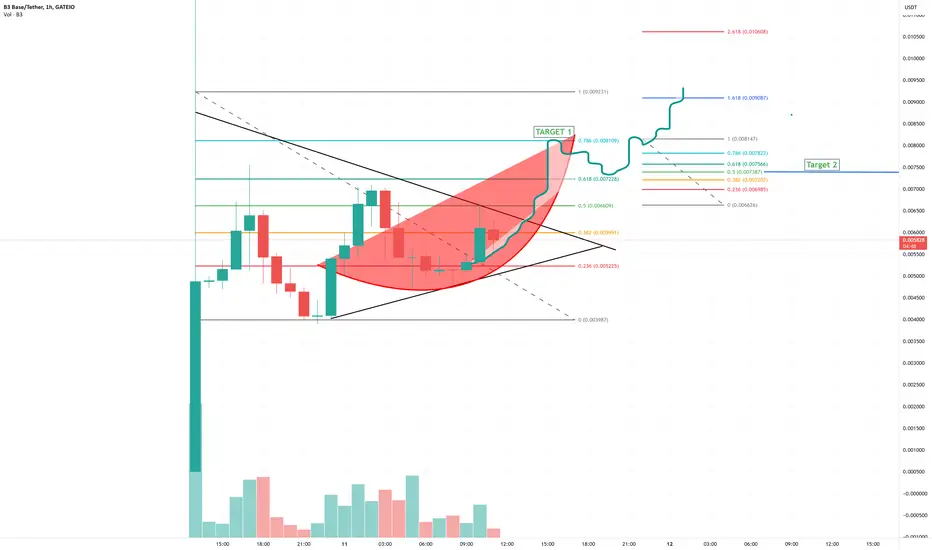
Symmetrical Triangle Breakout Attempt! 📈 OMXSTO:B3 - Symmetrical Triangle Breakout Attempt! 📐
✅ OMXSTO:B3 has broken out of a symmetrical triangle pattern.
🔴 Next hurdle: Needs to break and close above the red resistance zone for further upside.
🎯 Potential target: Green line level if the red resistance is broken! 🚀

Time for buy B3TP1: 0.00660
Target Logic: Close resistance + 1:1 risk-reward ratio.
TP2: 0.00695
Target Logic: 1.618 Fibonacci extension and previous high.
TP3: 0.00730
Target Logic: 2.618 Fibonacci extension and psychological round level.
Stop-Loss (SL) Level
SL: 0.00610
Logic: Buffered safety level below

#B3USDT remains weak—expecting further decline!📉 SHORT BYBIT:B3USDT.P from $0.007859
🛡 Stop Loss: $0.008012
⏱ 1H Timeframe
✅ Overview:
➡️ BYBIT:B3USDT.P remains in a steady downtrend after retracing to the resistance level.
➡️ POC (Point of Control) at $0.00962 confirms seller dominance, and the current price trades below the high-volume

b3 Token gaming In here are some key targets using the fin retracement and trendlines. These are short term price predictions. on the 1 hour chart
See all ideas
Summarizing what the indicators are suggesting.
Oscillators
Neutral
SellBuy
Strong sellStrong buy
Strong sellSellNeutralBuyStrong buy
Oscillators
Neutral
SellBuy
Strong sellStrong buy
Strong sellSellNeutralBuyStrong buy
Summary
Neutral
SellBuy
Strong sellStrong buy
Strong sellSellNeutralBuyStrong buy
Summary
Neutral
SellBuy
Strong sellStrong buy
Strong sellSellNeutralBuyStrong buy
Summary
Neutral
SellBuy
Strong sellStrong buy
Strong sellSellNeutralBuyStrong buy
Moving Averages
Neutral
SellBuy
Strong sellStrong buy
Strong sellSellNeutralBuyStrong buy
Moving Averages
Neutral
SellBuy
Strong sellStrong buy
Strong sellSellNeutralBuyStrong buy
Related pairs
Frequently Asked Questions
The current price of B3 / Tether (B3) is 0.005013 USDT — it has risen 0.89% in the past 24 hours. Try placing this info into the context by checking out what coins are also gaining and losing at the moment and seeing B3 price chart.
B3 / Tether price has risen by 6.86% over the last week, its month performance shows a 24.55% increase, and as for the last year, B3 / Tether has decreased by −15.03%. See more dynamics on B3 price chart.
Keep track of coins' changes with our Crypto Coins Heatmap.
Keep track of coins' changes with our Crypto Coins Heatmap.
B3 / Tether (B3) reached its highest price on Feb 21, 2025 — it amounted to 0.130000 USDT. Find more insights on the B3 price chart.
See the list of crypto gainers and choose what best fits your strategy.
See the list of crypto gainers and choose what best fits your strategy.
B3 / Tether (B3) reached the lowest price of 0.003051 USDT on Apr 9, 2025. View more B3 / Tether dynamics on the price chart.
See the list of crypto losers to find unexpected opportunities.
See the list of crypto losers to find unexpected opportunities.
The safest choice when buying B3 is to go to a well-known crypto exchange. Some of the popular names are Binance, Coinbase, Kraken. But you'll have to find a reliable broker and create an account first. You can trade B3 right from TradingView charts — just choose a broker and connect to your account.
B3 / Tether (B3) is just as reliable as any other crypto asset — this corner of the world market is highly volatile. Today, for instance, B3 / Tether is estimated as 3.21% volatile. The only thing it means is that you must prepare and examine all available information before making a decision. And if you're not sure about B3 / Tether, you can find more inspiration in our curated watchlists.
You can discuss B3 / Tether (B3) with other users in our public chats, Minds or in the comments to Ideas.