BAL to $30 Looks like a great entry for the Balancer coin. One of the Top DEX different EVM chains with over a billion dollar in TVL. Having fantastic tokenomics and continuous revenue throughout the bear market as well.
Definitely one of the low cap coin to keep in the bag.
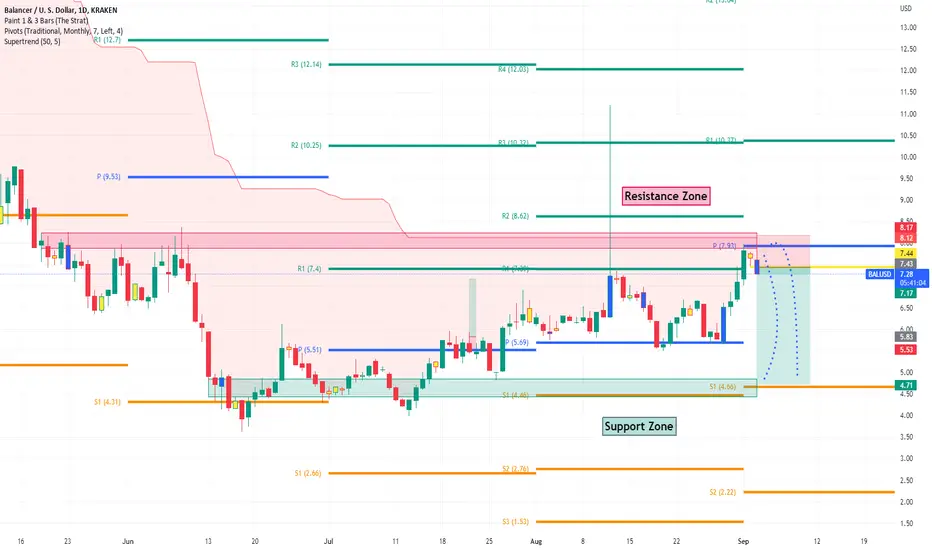
BALBULLUSD trade ideas

$BAL #Balancer Trading IdeaBAL/USD (Balancer) at this current moment is rising back up to retest that resistance box. If it breaks to the upside, through this red resistance zone, there is a potential to see another leg up on the price. Full send after a breakout.

Take a long on BALUSD on 4 hour time frame with sniper precisionThe sniper precision strategy that has confirmed with the upward arrow and breaking of resistance that is a minor one.be all hands on where to place sp

Balance #BAL breaking out inv. head & shouldersIt doesn't have huge targets
but it is a safe , solid , play .... meh
Good pattern though!

BAL/USD FEB21-28BAL/USD
1D Daily Chart
LOG Chart
possible $10 per bal?
reasons:
-climbing up making higher highs, higher lows, and climbing trendline
-golden lines represent support/resistance - clear the thick golden line successfully and an ultra bullish scenario can send it to $10

BALUSD - 35% Up o r 35% Down at Pinch Point!Hey guys, have you checked Balancer recently? It's reaching the very end of a pretty symmetrical triangle formation and this generally means something dramatic is about to happen!
BAL has tried to push the upper trend line acting as resistance once before and got denied, we're now at a critical point once again with the price hitting the same trend line - will it bust through this time and reach profits of 30-40%?
Or will it bounce off resistance and stay within the symmetrical triangle for a short while?
Or will it be declined by the upper trend line, travel through the current consolidation zone and out the back end of the triangle all the way down to previous levels of support at 30-40% below the current price?
What do you guys think?
If you enjoyed or agree with this idea - drop us a comment, like & follow! :)

BALUSD4 hours dynamic reactor. Showing signs for a bounce here. If BTC and ETH does not make a big drop, BAL should bounce for decent gains!

#BALUSD short ideaHello dear Traders,
Here is my idea for #BAL
Price finds resistance at super trend line and closed below the yellow trigger line in the 4h chart. Trade already active.
Please feel free to ask any question in comments. I will try to answer all! Thank you.
BAL 20% Potential Gains on the BooksBAL looking to expand about 20% to the 1.618% Fibonacci if the TRR retest plays out -- and if BTC continues to behave. Please DYOR and trade at your own risk.

Balancer (BAL) - hidden bullish divergenceOn the above daily chart price action has corrected over 80% since May of last year. Now is an excellent time to be long. Why?
1) The ‘incredible buy’ signal printed.
2) Trend reversal, higher highs / higher lows are printing in price action and RSI.
3) Hidden bullish divergence. This is defined by price action printing a higher high at the same time an oscillator prints a lower low, namely stochastic RSI.
4) Lastly on the weekly BTC pair price action breaks through the 21-week EMA support (below).
Is it possible price action falls further? Sure.
Is it probable? No.
Target? $100, at first. This is derived from the falling wedge breakout as shown on the 10-day chart below. The flagpole of the wedge measures the target.
Good luck!
Ww
Weekly BTC pair
10-chart


BAL really wants to Go. 65$ Incoming Sooner then you Think.BAL continuously trying to break out of this pattern. It really is ready to go and flirting with upper band. When markets shifts, it will pump. Very hard. Most will be suprised and FOMO at Higher prices. Do you have the nerves to buy when there is bloods on the streets?
First target 65$. Buy and have patience. I am waiting with my positions over 6 months, but upcoming 3 months will change everything.
Don't be too late at the party.
Goodluck. Let this age as fine wine.

$BAL long trade planEntery now with stop below conslidation zone
Target length of move from
double bottom to swing high
Hover over green/red box to see
stop/target prices

$BAL long trade planENTER NOW WITH STOP BELOW
CONSOLIDATION ZONE
TARGET LENGHT OF MOVE FROM
DOUBLE BOTTOM TO SWING HIGH
Stop below red zone, target top of green zone

Bullish on Balancer BALBAL was rejected on daily golden fib yesterday. But working to break it so far today. Keep an eye on it. If continues up and breaks on a daily close. You can expect $32 with pit stops at $22 and $25.

Balancer BAL vs USD / BTC / ETHA opportunity now exists following a 80% correction since early May. A higher low in price action and the oscillators follow a ‘incredible buy’ condition (orange columns).
The situation on the BTC and ETH charts is remarkably similar (below). A higher low is printed following a ‘incredible buy’ condition with price action now finding support on the 786 Golden ratio. This price level is also past support - look left.
A asset that is bullish across all three pairs is not to be ignored.
A buy from $17.30 is amazing.
Good luck!
WW
1-day BTC chart:
1-day ETH chart:

BALUSDPretty much Bullish on Balancer
-Demand Zone on the support price
-Vortex Indicator showing good blue line (uptrend)
-Trendline Breakout
-MA200 (4h) below the price after Trendline breakout
this is not financial advice, this is just how i trade personally
Trade safely.

BAL-LONG BAL is in a Rising wedge, has great potential to complete the FIB38 level....
Like this idea? Please do a thumbs up.
Thanks for watching.

BALANCER flip to happen soonBalancer has been in a heavy accumulation zone since 6th December. The PSAR bottom is setting in where S/R flip will happen. DYOR. Target could be the first resistance zone between 19.65 and 20. After that is 35. Good luck.

Long BAL/USD - Keltner SwingTesting a new strategy using the Keltner channels
x2 Keltner
x2 & 1.5
x4 grid chart
1m, 15m Scalp
1hr, 4hr Swing

BALANCER TO $120.00+!Balancer appears to be finishing its correction and is due for an explosive breakout within the next 120 days.
Balancer has been forming a long-term support line since July 2020, which has been tested and confirmed seven different times. Over the past week, Balancer has successfully retested the long-term support line and is now forming a descending triangle formation with a contracting range. Although the Relative Strength Index (RSI) is still low at 40, RSI has been rising over the past week. Further, the Awesome Oscillator has begun to show green candles which indicate a reversal trend in the near future.
Balancer has recently confirmed partnerships with Fei DAO and Beethoven-X to further integrate its Balancer V2 Liquidity Pools onto other networks, and we should expect a large inflow of capital into its liquidity pools in the near future.
Within the next 120 days, I expect Balancer to approach the 1.618 Trend Fib Extension at $126.00. Once Balancer reaches this target price, I will make another post to update my price prediction.

26.-26.5Having price staying upside 23.5 showing signs of maintained strength make me aim at 25.26. next. And break back under 23. with signs of weakness from buying interest would make me consider more testing of 19.-20., and look for weakened supply around that area to initiate buying positions.
Daily
We got our first stop in action at the 19. area on the 21th September, and then it started building a cause with accumulation characteristics.
If we zoom in;
Here good eventuality if demand volume doesn't increase now.
Weekly

$BAL Bullish Gartley breakoutBAL breaking above resistance with positive momentum building on the MACD as we enter the bullish control zone on the RSI. Historically above this zone, its straight up.
