BANDUSDT.P trade ideas

Band breakoutBand is showing a break from a descending wedge to the upside. Unsure how far it'll run - fischer probably shows a little retracement but this may be tradable. It's at least settling down a bit after jpow's speech so looks somewhat tradable.

Band potential trend break to the upsideMarket conditions pretty sketchy but seem generally supportive. I'm longing band here with a tight sl of 2.095 and will monitor and probably take a couple stabs at entry if it draws differently. The RR is so good on this area that I'll be willing to loose a few tight trades to catch a break if it happens.
Just manage your risk. This market is so hard to read and trade. Be careful, protect your capital. No more than like 1/3 of a point risked on something like this so you can mess up a bit and just wait for something clearer if volume doesn't flood in.
Good luck.


BAND USDT Bullish FormationTriangle and not well formed but potential Gartley make it seems bullish for me. Htf resistance is 4$ and Fib 0.618 is TP1

BAND CAN GO UPHello, dear traders. how are you ? Today we have a setup to buy/long the BAND symbol.
For risk management, please don't forget stop loss and capital management
When we reach the first target, save some profit and then change the stop to entry
Comment if you have any questions
Thank You

Band Protocol Rant | Volume Signal + Mirror ImageOk my friends... Are you aware that the only reason that I am writing here is to call your attention to something great that is about to happen?
Are you aware that the only reason why I am here, sharing my Soul, is so that I can call your attention to these opportunities and you can take advantage before the rest of the world does.
I do it truly because I know what it feels to be on the low end.
I also lived through this bear-market and has been the worse.
I also know the feeling of buying early, of winning and the gratefulness that develops once we profit from our trades.
So do what you may... But consider this...
If the market doesn't turn now, it will do so in a matter of months or even weeks.
Try spot and forget margin/leverage.
Only use Margin/Leverage if you have been trading spot successfully for 3-5 years or, if you have a stable life and have control of your emotions.
There is price to pay to learn.
Anyways, when trading spot the risk is so low, that if anything goes wrong in the worst case scenario any mistake can simply turn into a long-term wait.
Since we are close to the bottom, the wait can be short and after the wait comes the bullish wave.
Ok. Band Protocol (BANDUSDT).
I see this on the front page of TradingView, where it says "Community trends", so I guess you guys are looking at this.
I read hundreds of charts.
And for trading, each chart should be considered separately.
But to get a feeling of the market and to know what will happen next, we have to see/read everything possible and that will give you the feeling of where we are at.
The volume signal is the strongest of all.
On the last week of October, BANDUSDT shows the highest volume ever weekly by a lot.
This tells us one thing.
For this pair, the bottom is in.
The second signal is the "mirror image".
On the left side we have a crash... What goes down...
On the right side the mirror reflects, the contrary of what we had on the left... Then goes up!
That's all my friend.
Thanks a lot for your continued support.
Namaste.

BAND Protocol very fluctuates. Good prospects for earning moneyThe BANDUSDT price is quite dynamic and has been trying to break through the red line of the falling trend throughout November.
During November, buyers organized 3 growth impulses: the first +200%, the second +100%, and the current third is currently +50%. A good regularity)
Since the coin is very fluctuating, it is better to trade it by placing limit orders for buying in advance and similarly for selling at strong levels.
What we did)
We left all the levels from which we trade on the chart - use it if you want
Now the BAND price has once again hit the trend line, and therefore the resistance level, which means it is logical to cover part of the long position. The other part of the long position can be kept up to $2.75, because there is a chance that a consolidation triangle will be formed.
We are ready to take the next long if the price of the BAND Protocol token will confidently be fixed above $2. We hope it will already be above the trend, and then we can more confidently dream of BAND at $7
_____________________
Did you like our analysis? Leave a comment, like, and follow to get more

BANDUSDT | SYMMETRICAL TRIANGLEBANDUSDT has been trading with in a symmetrical triangle.
The price has been converged.
Now it is trading at higher side of triangle.
The bulls need to break above the triangle for further upside trend.
Manage your trades accordingly.

BAND Bullish consolidation Hi Tradingview,
BINANCE:BANDUSDT
BAND has double bottomed at 1.7046. We are expecting bullish movement to the 1.72 fibonacci line then continueing to 1.75+
We can also see TSI is curing towards a bullish takeover on the 1 hour timeframe.
Trade Parameters
Entry 1.70 - 1.72
Stop loss: Below 1.69
TP1: 1.72
TP2: 1.75
TP3: 1.8

BANDUSDT | RESISTANCE BROKENBANDUSDT has broken above the falling resistance.
The price need to hold the support and breakout level.
The bulls can target 0.50 fib level.
Manage your levels accordingly.

BAND protocol formed bullish Gartley for upto 95% pumpHi dear friends, hope you are well and welcome to the new trade setup of BAND protocol token.
Our last harmonic trade setup of BAND was as below:
Now after a long-trim, on a daily time frame, BAND has formed a bullish Gartley pattern.
Note: Above idea is for educational purpose only. It is advised to diversify and strictly follow the stop loss, and don't get stuck with trade


BAND/USDT BUYBAND/USDT
buy zone 1.6900
TRGT 4.2458 LONG TERM
apprx profit 140% plus
stop loss 1.0095

BAND is Ready For SHORT PositionBAND /USDT is Going to get a good setup for SHORT POSITION
you can get this position with LEV2 X
Good Luck & dont forget to set SL & TP

one man BANDIs anyone out there?
Oh I forgot u all shorting the bottom
Anyways
U can buy this breakout or when I sell at 5 bucks
NOT TARDING ADVICE
GRI 2022

BANDUSDT | BOUNCE FROM SUPPORTBANDUSDT has been trading with in a descending triangle .
The price has been converged and now broken above the falling trendline.
The bulls will took control from here.
Manage your trades accordingly.

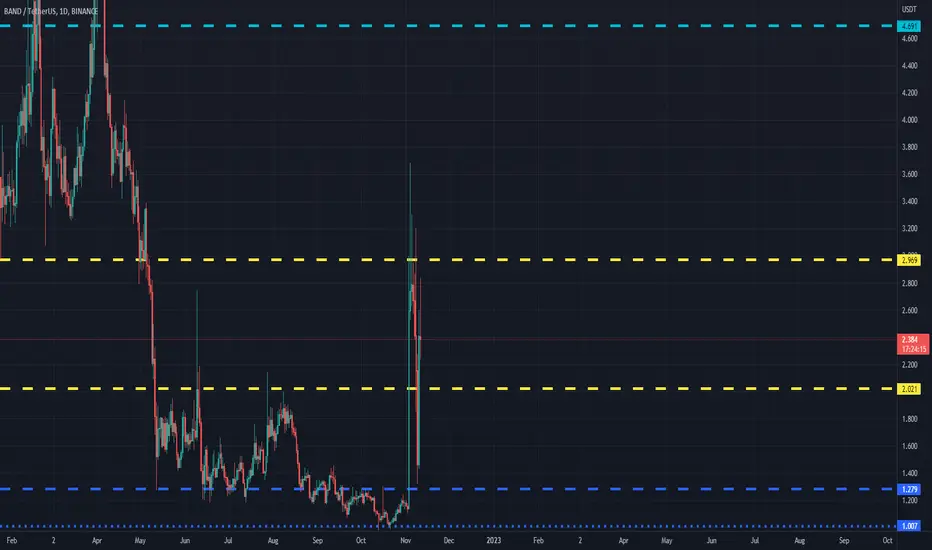
BANDUSDT (Band Protocol) Daily tf Range Updated till 11-11-22BANDUSDT (Band Protocol) Daily timeframe range. another alt with massive space inbetween its range levels. it got massive volatile moves which makes it a high risk and reward alt. its also used by retail p and d groups hence the wicks and volume. massive moves got chance of massive profit same goes to loss.


Wyckof Distribution UTADPerfect short entry at the UTAD, so far so good with the schematic. 1min Rising wedge and 15min stochastic rsi getting overbought and bearish divergence on RSI. Declining volume with the last pump in UTAD with potential climax volume at the top.

SHORT - BAND dump to 1.98SHORT - BAND dump to 1.98 with Technical analysis and Fibo....
look at to chart...
Sell Zone : 3 - 2.7
First Target : 1.98
Stop loss : 3.41
good luck...

SHORT - BAND dump to 2.1SHORT - BAND dump to 2.1 with Technical nalysis and Fibo....
look at to chart...
Sell Zone : 3 - 2.7
First Target : 2.1
Stop loss : 3.41
good luck...
