AMAT trade ideas

AMAT, A rising stock! many chances for traders and investors!AMAT made a new ATH yesterday which confirmed completion of a correction and going up to new highs.
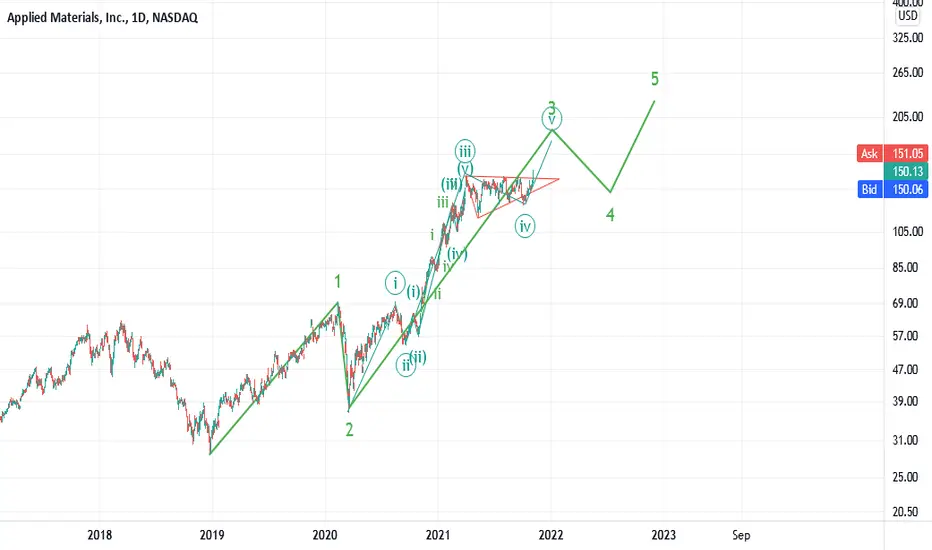
AMAT is clearly in up going wave cycles. It offers many chances for both short term traders and long term investors /share holders. How far it goes higher? lets follow the analysis !
As shown on the chart AMAT currently is completing wave v (in circle) of a larger degree wave 3 which probably can push the price up to around 180 USD. Then correction of shown wave 4 will start which can push price back to 130-150 zone. Another actionary wave up to above 200 USD will complete an Elliott wave cycle which means considerable correction start after this cycle completion.
It is worth to note this mentioned complete cycle can be just wave 3 of 3 a two larger degree cycle which means we may see unbelievable targets for AMAT or we may have just an extended wave 5 ! Should it need any update we can do it later.
Wish you huge profits my friend .

11/7/21 AMATApplied Materials, Inc. ( NASDAQ:AMAT )
Sector: Producer Manufacturing (Industrial Machinery)
Current Price: $153.29
Breakout price trigger: $146.00 (hold above)
Buy Zone (Top/Bottom Range): $149.50-$144.50
Price Target: $165.50-$169.00 (2nd)
Estimated Duration to Target: 45-47 (2nd)
Contract of Interest: $AMAT 12/17/21 160c, $AMAT 1/21/21 170c
Trade price as of publish date: $5.00/contract, $4.50/contract

AMAT (Applied Materials, Inc.) | All-Time HighAMAT. Watch for buying opportunities. Watch for a bullish price action signal on the Lower Time Frames.
End Of Accumulation - Extremely Bullish Effect On AMATAMAT exited the channel and is ready for a very strong, sharp movement upwards, that can, I am expecting a BUEC before it would start moving, if that wouldn’t appear, I won’t enter since the RRR would be to risky at that point, a very good technical that is worth following

AMAT - Clear BreakoutWith all chip stocks running, AMAT has given the breakout prior to the Earnings. Can it sustain and move higher?

AMAT, Long in the case of bullish reaction ! A new ATH ?Is AMAT going to show a bullish reaction to the strong support and make a new All Time High? Lets follow!
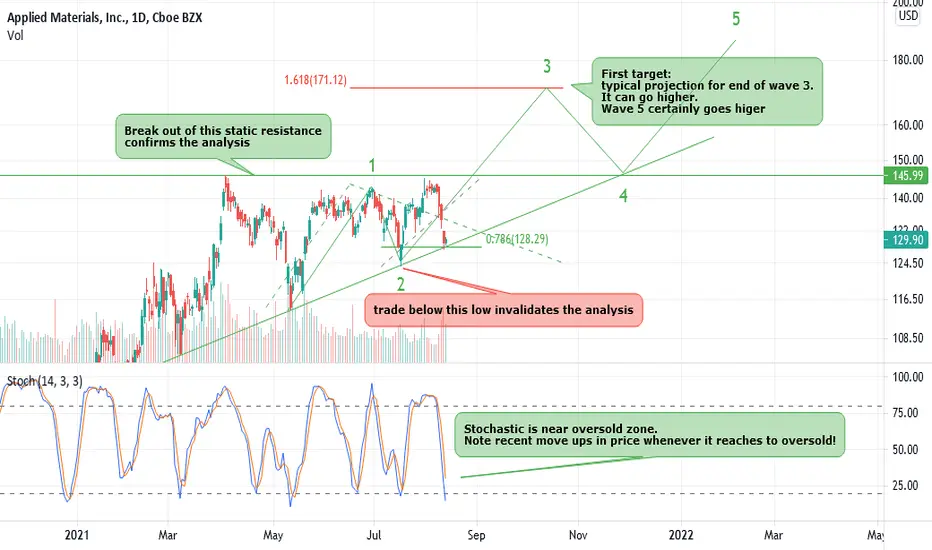
Price is clearly around dynamic short term trend line support . This is fourth time that price reaches to this support. Last three times it could push up the price successfully. Moreover, price is now exactly at 0.786 Retracement of last move up.
Stochastic indicator is near oversold zone. Please note that we had a nice move up whenever it has recently reached to this area.
In terms of Elliott waves , We may be at the start of wave 3 of 3. Possible wave count has been shown on the chart. If true, first target will be around 170 USD which corresponds to 1.618 projection of labeled wave 1. It may go higher. We can update it later. Wave 5 will certainly goes above 170 !.
Please notice the notes on the chart about the conditions which confirms or invalidates this analysis.
Although all evidences show that it is ready to make a new move up, we have to trade objectively. We set out stop loss carefully ( which is the last low shown on the chart) in the case of opening a long position.
We try to see the chances and find ideal setups but we always keep in mind that market is the one who choose the path and we are the one to follow. That is why I chose this title : " Long in the case of bullish reaction! "
Good luck my friends.
AMAT - BEARISH
ENTRY: On break below $128
SL: 136.60
PT 1 (trim level: Trim 50-70% here) - $115-$118
PT 2 (Closing position here) $100.75 - $105
Rectangle top and Major Wave 3 hitting 262% extension level. Needs much larger correction here on Wave 4. Most will this is a bull flag and it is, but based on 262% extension level, I favor a pull back here in wave 4 into green box area before new ATH's.

Key Ideas to trade big daily structures. Example on AMATI will keep this post short, so you can get a general idea of this trading style.
First of all , we have a situation where the price could not make a new ATH in 200 days. It's important to notice that we can draw a clear structure with well-defined limits because the price stayed in a clear range between 146 and 114
Now that the structure is clear, it is easy to know if we are observing a clear breakout or a fakeout, thanks to the limits we have drawn and the way the price has respected them.
So, how to proceed now? We ask this simple question. How many times can I find a similar situation like this in the past? Imagine we say four times. Ok, which is the sequence where the price goes from being inside the range towards a new bullish impulse?
Here is where technical analysis will help you create a map or sequence of movements to say, "Hey, there is a pattern here that I can wait." Once you have defined that, draw it in your chart.
In this case, my final filters are:
a) Wait for a new ATH (that's the confirmation that the structure has been broken)
b) Wait for a 2 to 4 weeks correction (that means that after the breakout, the price is not able to make a new ATH)
c) IF that happens, trade on the new ATH, with a stop loss below the 2 to 4 weeks correction and Take profit on the final Fibo extension
d) IF that doesn't happen, do not trade
e) Move the stop loss to the entry-level if the price reaches the first Fibo Extension.
f) Risk: We will use 2% of our capital on the stop loss.
g) Relax and Wait.
As you can see, this is a methodic way of developing a setup that provides a lot of control over your executions, and you can proceed based on a pre-established set of rules. This is extremely helpful to overcome emotions and bring consistency to your strategy.
Remember: Do not try to avoid a stop-loss; create procedures to control them. My win rate right now is 55% - 60%. That means that almost half of the time, I'm wrong; HOWEVER, when I'm right, I make more than 2 dollars of every dollar I'm risking. Trade like a casino!
Thanks for reading!

AMAT go ZOOOOOMAMAT is bound for a strong impulsive move
✅ Phase 1: a harsh pullback
✅ Phase 2: a period of consolidation
✅ Phase 3 : an impulsive move to the 0.61 line of the pullback move
❌ Phase 4: another consolidation perdiod: Skipped
✅ Phase 5: a drop to the 0.38 line of the fib retracement
🤩 Phase 6: Back to the top we go

Buy AMAT 12/10/2021You can buy AMAT target 144.19 stop loss 119.9
Money management your responsibility.
I recommend entering a maximum of 10% of the portfolio.
Good luck

KhanPhelan 5m Khan's Live-Charting 05 - $AMATBeautiful Channel - accumulate shares around the current price and be patient for the swing towards the upside

AMAT Accepting 127.98NASDAQ:AMAT
The lines represent the price level that has been traded upon or will be traded.
The more it hit the line, the stronger the level.
It can be use to set profit taking price or stop loss price.
Every level is of same significant until order flow trades upon it.
DYODD.


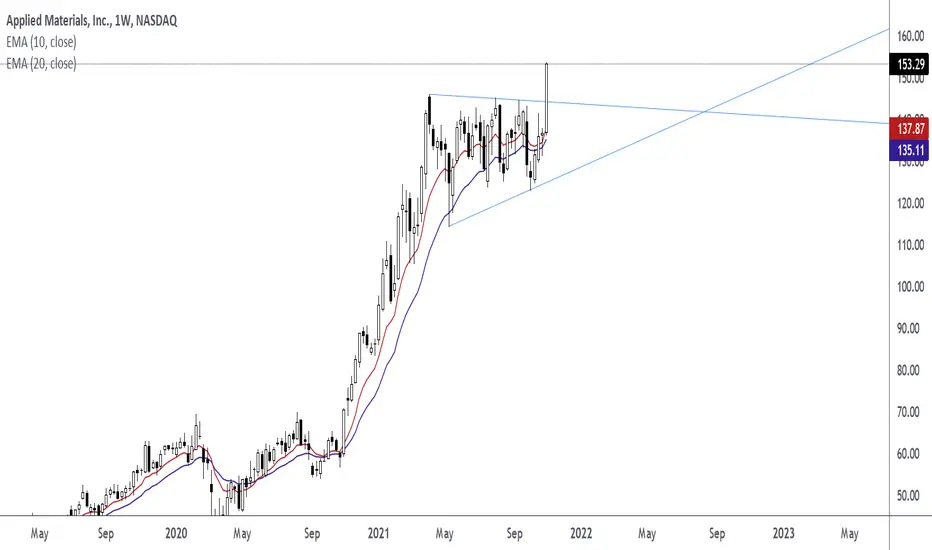
AMAT ascending trianglethis is the weekly chart it looks super solid and like it can move big to a high of maybe $175
I have 160 calls
hit the lines 4 times in total so the 5th move could result in the big boom as the last leg in the trade until we see a downturn
looks like a solid trade right now good luck homies

9/26/21 AMATApplied Materials, Inc. (AMAT)
Sector: Producer Manufacturing (Industrial Machinery)
Current Price: $141.92
Breakout price trigger: $139.25 (hold above)
Buy Zone (Top/Bottom Range): $140.00-$131.75
Price Target: $146.00-$148.00 (1st), $165.50-$169.00 (2nd)
Estimated Duration to Target: 31-33d (1st), 122-130d (2nd)
Contract of Interest: $AMAT 11/19/21 150c, $AMAT 1/21/21 165c
Trade price as of publish date: $4.40/cnt, $3.25/cnt

$AMAT - Flagging in weekly, watch for break above 146 for calls$AMAT - Flagging in weekly, watch for break above 146 for long calls with stop loss of break down


$AMAT Applied Materials on Breakout Alert
Hopefully you find the chart helpful in terms of Supports & Resistance etc.
we refrain from adding commentary on the chart as that is reserved for our members and we are very conscious of not giving financial or trading advice.
Thank you for taking time to consult our chart and we would really appreciate a like, follow or comment.

(US) AMAT VCP Setup Follow UpI shared AMAT previously at beginning of Aug (link below) and unfortunately the previous movement is not strong and the chart develop another contraction C3. The overall contraction for AMAT as shown below:
C1: -21%
C2: -12%
C3: -12%
C4: -4%
C5: -3%
Pivot point observed above the trendline. Awaiting volume and breakout!
Disclaimer:
Trade at your own risk. Not a buy call, sharing based on technical analysis with pattern and indicators.


short on AMATwe can open a short on it with a good R/R Because the price energy is low and needs some correction
