Holy mother of godMaybe one last bounce off the lower support, then blast-off. I wouldn't try to catch the bottom though, too much upside potential on this one.
BCHUSD.P trade ideas

Bitcoin Cash Price Analysis: we expect BCH/USD to test $615 Bitcoin Cash has experienced yearly gains of up to 180% since January 1st, counting down to the second-to-last month of 2021. Thereby suggesting significant returns for cryptocurrency traders from the annual price opening of $342 to today’s daily high of $619.

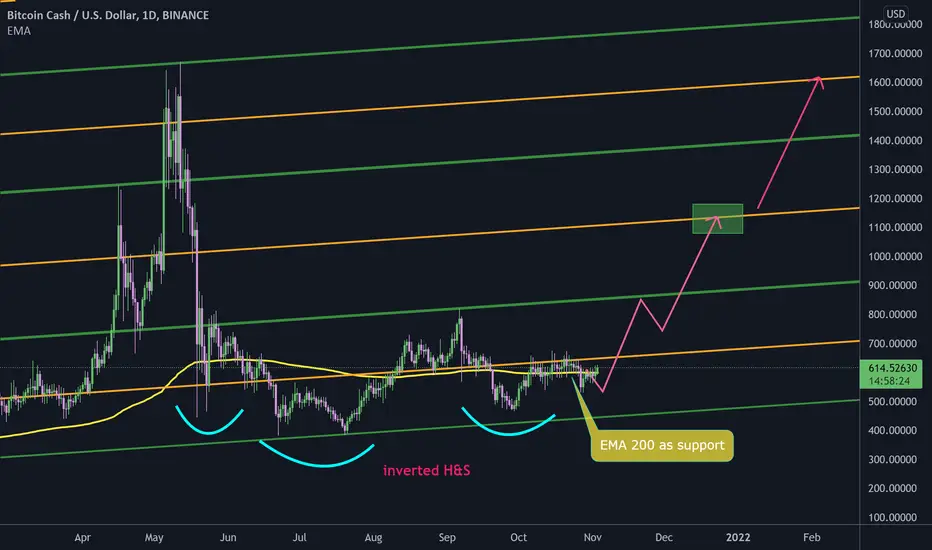
BCH inverted head and shoulders#BCHUSD
$BCH shaped inverted head and shoulders that price can reach $1000, a break above resistance of $1200 will rise price to $1600 and more.
BCH - The Phoenix Rises From AshesBehold the beast! For once it rises from ashes, there would be no stopping the underdog. The regal phoenix shall claim its rightful throne.

BCH UpdateBitcoin cash is coiling up for a massive move, get ready for this pump. q4 will be insane fireworks!!!

Bitcoin Cash - bull run targetsNothing new - if bitcoin surges, the whole market will rise. Rising tide lifts all boats.
These would be my views of targets. Barring any crazy Fud or some new major positive developments, which would move targets higher and/or lower. Even though my previous BCH idea hit all targets and built that as support range, no movement is guaranteed - trade at your own risk and set your stop losses

BCHUSD update long than shortafter re-analysis I have decided to trade small long . I have marked the zone and the price. I am waiting for the price to return to the zone and after the signal from the chart I will open a long position. Then bee watched the short position in the marked zone

BCHUSD shortAs with BTCUSD, however, I am looking down now. I made a short position from the designated zone and TP


☑️BCHUSD: entering the SELL-phaseBitcoin Cash is trading at $587 . There are clear signs of a bearish trend on BCHUSD.
As part of the Bitcoin Cash forecast, an approach to the level of $552.85 is expected. Where, most likely, we should expect an attempt to continue the fall in BCHUSD and the further development of the downward trend.
🔔 Proposed deal for this tool 🔔:
🔴Entry Point - 591.70
⛔️Stop Loss - 607.31
✅Take Profit - 557.87
Thanks for your comments and likes 👍

BCHUSD buyI marked buy positions in line with the current trend. I am waiting for a signal from the chart to open a long position

BCHUSD D4: +800% gains BULLS THE BEST level TO BUY/HOLD(NEW)Why get subbed to me on Tradingview?
-TOP author on TradingView
-2000+ ideas published
-15+ years experience in markets
-Professional chart break downs
-Supply/Demand Zones
-TD9 counts / combo review
-Key S/R levels
-No junk on my charts
-Frequent updates
-Covering FX/crypto/US stocks
-before/after analysis
-24/7 uptime so constant updates
🎁Please hit the like button and
🎁Leave a comment to support our team!
BCHUSD D4: +800% gains BULLS THE BEST level TO BUY/HOLD(NEW)
IMPORTANT NOTE: speculative setup. do your own
due dill. use STOP LOSS. don't overleverage.
READ ENTIRE IDEA BEFORE EXECUTION!
🔸 Summary and potential trade setup
::: BCHUSD 4day/candle chart review
::: corrective cycle in progress no
::: expecting tech overshoot before
::: reversal off the cycle lows
::: updated/revised outlook
::: setup still valid as of RIGHT NOW
::: chart is LOG SCALE
::: get ready to BUY LOW later
::: currently/soon CORRECTION MODE
::: BUY LOW near cycle lows
::: entry - late Q4 2021
::: for now PULLBACK/CORRECTION MODE
::: on the right same a/b/c/d/e fractal
::: 2018/2019 fractal from the past
::: resulted in 800% gains off the ow
::: re-test of range lows is likely
::: point d is BEAR TRAP (fake breakdown)
::: SPECULATIVE SETUP
::: do your own due dill
::: and use proper risk management
::: TP bulls is +800% gains
::: details: see chart
::: FINAL TP is +800% gains
::: recommended strategy: BUY/HOLD after correction
::: TP BULLS +800% gains
::: SWING TRADE: BUY/HOLD IT
::: bull run not over yet
::: good luck traders!
::: BUY/HOLD and get paid. period.
🔸 Supply/Demand Zones
::: N/A
::: N/A
🔸 Other noteworthy technicals/fundies
::: TD9 /Combo update: N/A
::: Sentiment mid-term: BULLS/800% gains
::: Sentiment short-term: CORRECTION/MODE
RISK DISCLAIMER:
Trading Crypto, Futures , Forex, CFDs and Stocks involves a risk of loss.
Please consider carefully if such trading is appropriate for you.
Past performance is not indicative of future results.
Always limit your leverage and use tight stop loss.

Look out belowLooks like we may be heading back towards the 500-505 mark 1 more time before continuing upwards

BCH is one huge leading diagonal to $2200BCH is forming one huge leading diagonal.
This would give a rough target of $2200.
They could front run this last wave. Keep that in mind.
My chart is messy with my detailed count.
But, I think the diagonal is obvious.
I shared my chart, so you can view it in detail.


BchBreak 663$ and we should have a nasty run lose 607$ and we may be flipping to the bearish size of things seems
To be clinging to uptrend support nicely so far

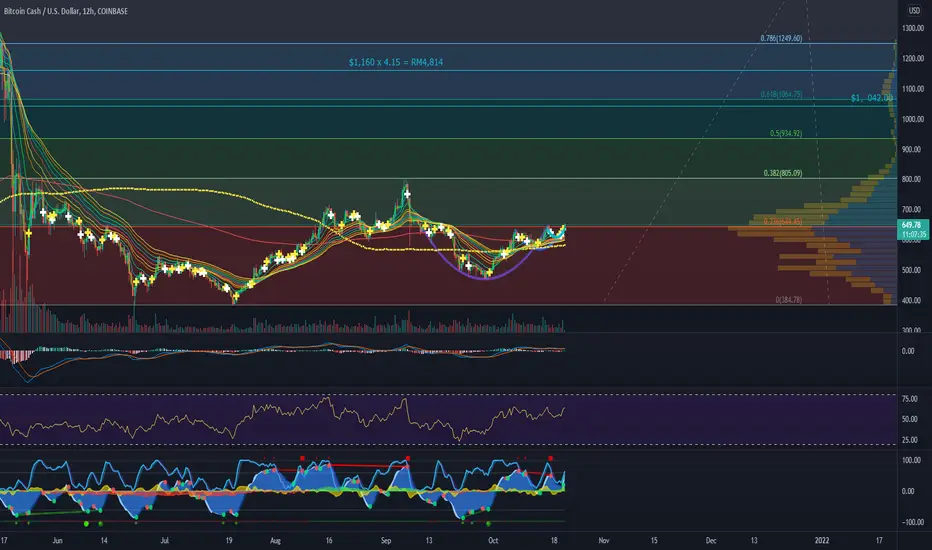
2021-10-21, BCH 12HR CHART. Bullish again.This is significant bullish news for BITCOIN CASH looking right now. Thought I have posted it yesterday but only on the other social media in private.
BCH/USD- Day trade Hello,
I have entered #BCH on a hourly day trade today. I entered at 622.65 with the target being $649.
This will be a 4.2% gain if target is reached.
The reason for this trade-
The price has broke above the hourly resistance and the H4 resistance. The momentum should help push the price up while being above the 9/20ma.
Good luck if you join.

BCH Price StandpointBitcoin Cash is holding steady above the support level of 600 as the bulls strive to retest the weekend’s high of 650. Since the beginning of the month, it has risen by about 22% having extended its rebound from below the psychological level of 500 late in September.
On a four-hour chart, it is trading slightly above the 25 and 50-day exponential moving averages. Besides, the formation of an inverted head-and-shoulder pattern, which is a bullish pattern, points to further gains.
In the short term, BCH price will likely hold steady above the support zone at 600 while gathering enough bullish momentum to reach and surpass the next target at 650.91. Above that zone, the next level to watch out for will be the prior resistance level at 675.61. However, this thesis will be invalidated by a move below the support zone of 600.

BCHUSD! Swing Trade Set Up!BCH is looking like it’s getting support on 50 MA and breaking the pattern. It’s it’s a great Risk and reward entry.
As always we put quality over quantity, don’t forget to follow us for SWING trades research on risk and Reward Ratio.
Don’t forget to subscribe to not miss future consistent researches.
Swing trading is great because you can create a lot wealth in % by risking less $$. Compound Gains.
Thank you for the Love, I really appreciate those likes, makes a difference.

Bitcoin Cash (BCH) - October 18Hello?
Welcome, traders.
By "following", you can always get new information quickly.
Please also click "Like".
Have a nice day.
-------------------------------------
(BCHUSD 1W Chart) - Medium to Long-Term Perspective
Above the 332.38 point: the uptrend expected to continue
Above section 517.20-702.98: Expected to create a new wave.
(1D chart)
Resistance section: 624.90-702.98
Support section: 435.70-517.20
If the price holds at 517.20-624.90, an attempt to break above the resistance level is expected.
To accelerate an uptrend, you need to break out of the downtrend line.
If the price declines from the support area, it may fall below the 332.38 point, requiring a short-term Stop Loss.
------------------------------------------
(BCHBTC 1W chart)
Above 0.02444-0.03406 interval: expected to continue upward trend
(1D chart)
Above 0.01153 point: turn into an uptrend
------------------------------------------
We recommend that you trade with your average unit price.
This is because, if the price is below your average unit price, whether it is in an uptrend or in a downtrend, there is a high possibility that you will not be able to get a big profit due to the psychological burden.
The center of all trading starts with the average unit price at which you start trading.
If you ignore this, you may be trading in the wrong direction.
Therefore, it is important to find a way to lower the average unit price and adjust the proportion of the investment, ultimately allowing the funds corresponding to the profits to regenerate themselves.
------------------------------------------------------------ -----------------------------------------------------
** All indicators are lagging indicators.
Therefore, it is important to be aware that the indicator moves accordingly with the movement of price and volume.
However, for the sake of convenience, we are talking in reverse for the interpretation of the indicator.
** The MRHAB-O and MRHAB-B indicators used in the chart are indicators of our channel that have not yet been released.
(Because it is not public, you can use this chart without any restrictions by sharing this chart and copying and pasting the indicators.)
** The wRSI_SR indicator is an indicator created by adding settings and options to the existing Stochastic RSI indicator.
Therefore, the interpretation is the same as the traditional Stochastic RSI indicator. (K, D line -> R, S line)
** The OBV indicator was re-created by applying a formula to the DepthHouse Trading indicator, an indicator disclosed by oh92. (Thanks for this.)
** Support or resistance is based on the closing price of the 1D chart.
** All descriptions are for reference only and do not guarantee a profit or loss in investment.
(Short-term Stop Loss can be said to be a point where profit and loss can be preserved or additional entry can be made through split trading. It is a short-term investment perspective.)
