Buy zone looking to take it to 635+Also watching a possible H&S formation at the 640 mark if rejected. Will keep you posted.
FB trade ideas

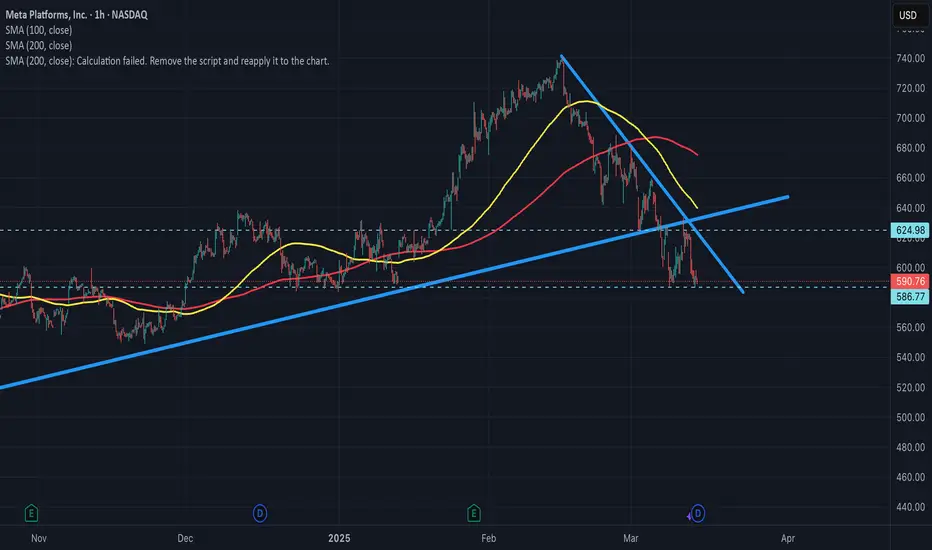
Meta - quick reviewMeta - if it breaks the 586 floor it's good for puts, and if it breaks the 624 ceiling or the trend ceiling, good for calls
Reversal To The Long on Meta Platforms. METAThe previous ides on short was very profitable and I believe that we are facing a local reversal here based on price action and volatility , stochastic indicators below. This is a within one candlestick set up, so relatively risky. And yet most pivot setups are.

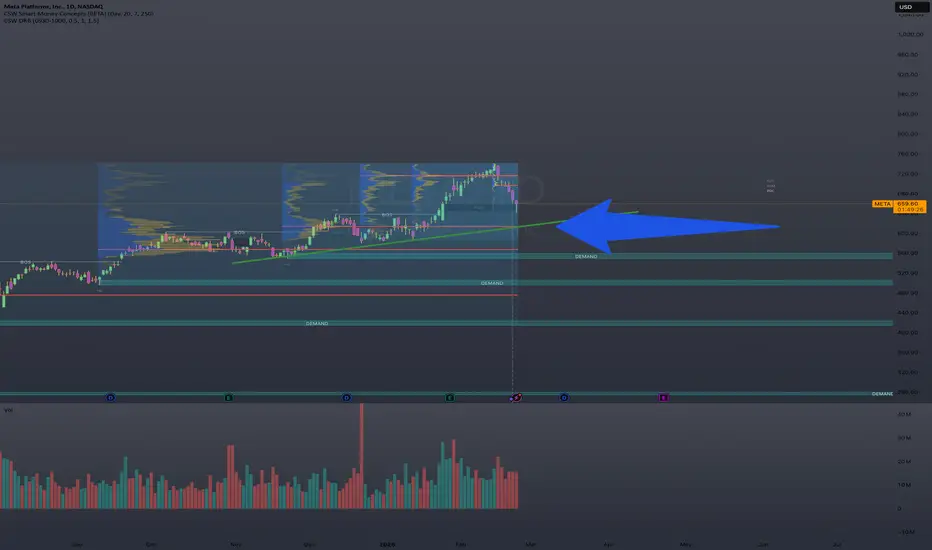
META - Top of Up ChannelMETA is at the top of a dominant channel
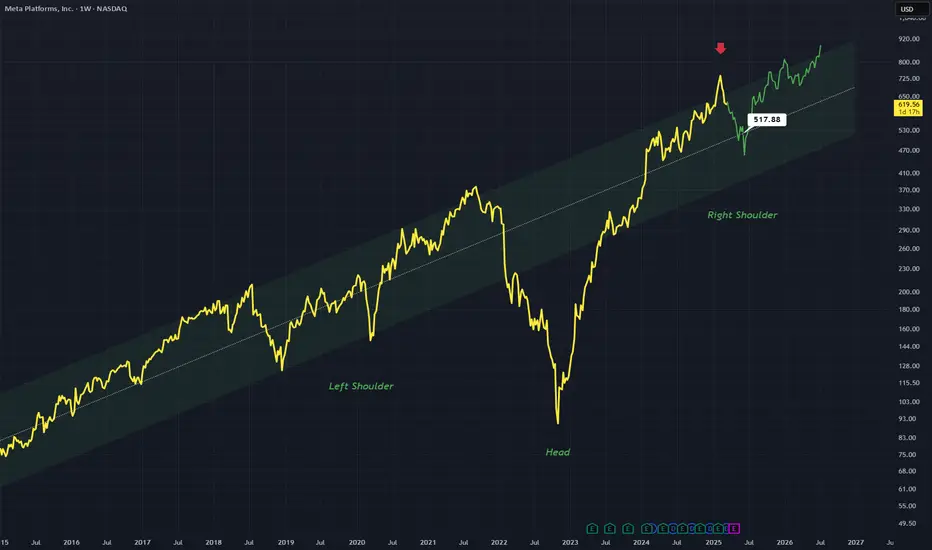
A kind of angled head and shoulder pattern can form if we assume a downward move on the right side
Downward move to the middle of the channel which I have labelled with the price label
Weekly timeframe
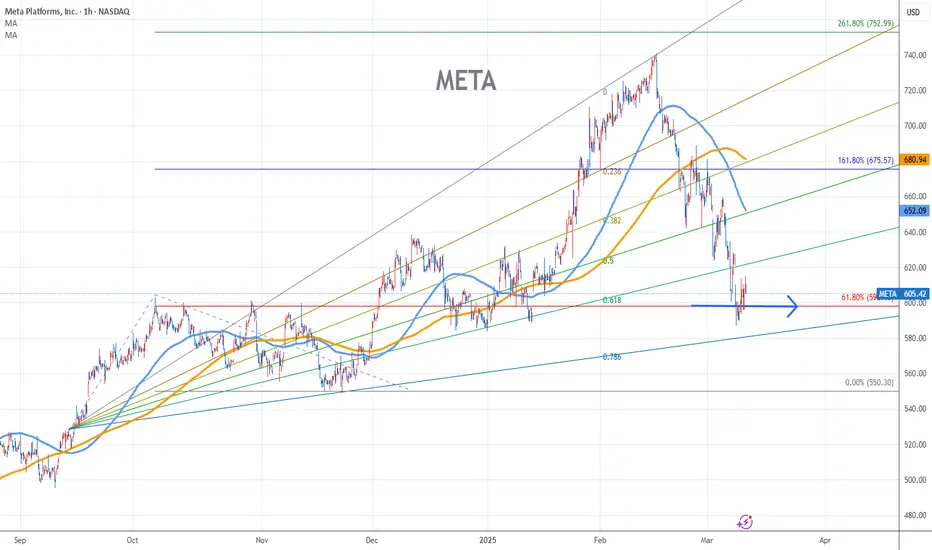
Meta Stock Chart Fibonacci Analysis 031125Trading Idea
1) Find a FIBO slingshot
2) Check FIBO 61.80% level
3) Entry Point > 600/61.80%
Chart time frame: D
A) 15 min(1W-3M)
B) 1 hr(3M-6M)
C) 4 hr(6M-1year)
D) 1 day(1-3years)
Stock progress: B
A) Keep rising over 61.80% resistance
B) 61.80% resistance
C) 61.80% support
D) Hit the bottom
E) Hit the top
Stocks rise as they rise from support and fall from resistance. Our goal is to find a low support point and enter. It can be referred to as buying at the pullback point. The pullback point can be found with a Fibonacci extension of 61.80%. This is a step to find entry level. 1) Find a triangle (Fibonacci Speed Fan Line) that connects the high (resistance) and low (support) points of the stock in progress, where it is continuously expressed as a Slingshot, 2) and create a Fibonacci extension level for the first rising wave from the start point of slingshot pattern.
When the current price goes over 61.80% level , that can be a good entry point, especially if the SMA 100 and 200 curves are gathered together at 61.80%, it is a very good entry point.
As a great help, tradingview provides these Fibonacci speed fan lines and extension levels with ease. So if you use the Fibonacci fan line, the extension level, and the SMA 100/200 curve well, you can find an entry point for the stock market. At least you have to enter at this low point to avoid trading failure, and if you are skilled at entering this low point, with fibonacci6180 technique, your reading skill to chart will be greatly improved.
If you want to do day trading, please set the time frame to 5 minutes or 15 minutes, and you will see many of the low point of rising stocks.
If want to prefer long term range trading, you can set the time frame to 1 hr or 1 day.
META: Key support! Watch out for a possible opportunity!For a few weeks now we have been experiencing PANIC in the markets due to Trump's AGGRESSION with tariffs. The question we all have to ask ourselves is whether the USA will enter a RECESSION and ALL COMPANIES will continue to fall sharply, or on the contrary, if Trump will negotiate and therefore the markets will RECOVER.
From my point of view, TRUMP has become too aggressive and IS ALREADY STARTING TO WORRY ABOUT SOME COMMENTS OF THE LAST FEW DAYS, and HE WILL NEGOTIATE!! Regardless of this, there are companies that despite the great fall suffered, REMAIN BULLISH AND POSITIVE in the year, as is the case of META, which has risen by +2% in 2025.
The graph above SHOWS YEAR BY YEAR the trend and WHEN a CHANGE IN TREND occurs, in this way we will see more clearly the current situation of the company this year. In the graph below with H4 time frame we see a ZOOM of the current situation to know more precisely when a floor is formed and the retreat phase in which it is immersed ends.
If we look at this year 2025, its TREND is still BULLISH in a RECOIL PHASE and at this moment it is in A VERY IMPORTANT SUPPORT that it should respect (zone 580) in order NOT TO START A CHANGE IN TREND.
If the zone respects it and a BOTTOM is formed, the price will quickly rise towards its first resistance at 641, which if it is surpassed WE WILL SEE NEW MAXIMUMS in the value.
---> What do we do?
1) If our PROFILE is AGGRESSIVE, we enter LONG IN THE CURRENT ZONE.
2) If our PROFILE is CONSERVATIVE, WE WAIT for a floor to form or for the price to surpass the 641 zone.
-------------------------------------
Strategy to follow IF OUR PROFILE IS AGGRESSIVE:
ENTRY: We will open 2 long positions in the current zone of 610
POSITION 1 (TP1): We close the first position in the 640 zone (+5.5%)
--> Stop Loss at 568 (-6%).
POSITION 2 (TP2): We open a Trailing Stop type position.
--> Initial dynamic Stop Loss at (-6%) (coinciding with the 568 of position 1).
---We modify the dynamic Stop Loss to (-1%) when the price reaches TP1 (640).
-------------------------------------------
SET UP EXPLANATIONS
*** How do we know which 2 long positions to open? Let's take an example: If we want to invest 2,000 euros in the stock, what we do is divide that amount by 2, and instead of opening 1 position of 2,000, we will open 2 positions of 1,000 each.
*** What is a Trailing Stop? A Trailing Stop allows a trade to continue gaining value when the market price moves in a favorable direction, but automatically closes the trade if the market price suddenly moves in an unfavorable direction by a certain distance. That certain distance is the dynamic Stop Loss.
-->Example: If the dynamic Stop Loss is at -1%, it means that if the price drops by -1%, the position will be closed. If the price rises, the Stop Loss also rises to maintain that -1% during increases, therefore, the risk is increasingly lower until the position becomes profitable. In this way, very solid and stable price trends can be taken advantage of.

Incoming 40% correction for FacebookOn the above 10 day chart price action has rallied 500% since October 2022. It is somewhat unfortunate to see so many long ideas at the moment.
Motley Fool August 8th:
“Here's how Meta could achieve a $2 trillion valuation within three years, and if it does, investors who buy the stock today could earn a 67% return.”
Very misleading.
Why bearish?
Failed support. It is very clear to see, price action has broken through support and confirmed it as resistance. You can see this more clearly on the Log chart below.
Regular bearish divergence. Multiple oscillators now print negative divergence with price action across a 50 day period.
On the monthly chart below a hanging man candle print can be seen. Although the candle does not confirm until the end of the month there is a clear indication of buyer exhaustion. This is an important trend reversal indication.
Is it possible price action continues to rise? Sure.
Is it probable? No.
Ww
Log chart
Monthly hanging man candlestick

Bullish abcd set upI see meta starting an uptick from the 5th Elliot Wave. This appears to be an impulse buying wave, which appears to be inside a bullish abcd set up, which is also correlating by the stoch rsi (abcd) set up

$META Tradespoon - Long Entry $618.57Tradespoon model generated long signal for Meta Platforms NASDAQ:META . Predicted range: $618.57–$644.03. Trend: -1.32%. NASDAQ:META
META at a Critical Reversal! Will It Break Out or Reject? Technical Analysis (TA) for Trading:
* Trend: META has been in a downtrend but is now at a key reversal zone with strong buying volume.
* Descending Channel Break? Price is currently testing the upper boundary of the falling channel. A clean breakout above $634.55 could signal further upside.
* Support & Resistance Levels:
* Immediate Resistance: $634.55
* Next Major Resistance: $659.36
* Strong Support: $610.00
* Critical Downside Level: $583.85
* Indicators:
* MACD: Showing a potential bullish crossover, indicating upside momentum.
* Stochastic RSI: Overbought, which could lead to a short-term pullback before continuation.
* Possible Scenarios:
* Bullish: A breakout above $634.55 can lead to $659.36, then towards $700+.
* Bearish: If rejected here, expect a retest of $610, then possibly $583.85.
GEX & Options Flow for META:
* Highest Positive NetGEX / CALL Resistance: $700 – Major gamma resistance.
* 2nd Call Wall: $750 – If price pushes beyond $700, we could see momentum toward this level.
* PUT Wall Support: $610 – Key area where dealers may start hedging and absorb selling pressure.
* IV & Sentiment:
* IV Rank: 40.6 (moderate volatility)
* Options Sentiment: PUTS 6.8% – Lower put positioning suggests traders expect upside.
* GEX: Negative, indicating increased dealer hedging activity.
Thoughts & Suggestion:
📌 Breakout Traders: Watch for a move above $634.55 with strong volume for confirmation. 📌 Pullback Buyers: A dip to $610 could offer a strong risk-reward entry if support holds. 📌 Options Strategy: Given the lower PUT wall, a breakout could lead to momentum-driven moves. A call spread above $650 could be a strong setup.
⚠️ Disclaimer:
This analysis is for educational purposes only and does not constitute financial advice. Always do your own research and manage your risk accordingly.

Massive inverted cup and handle Another massive inverted cup and handle on the 4hr chart looks complete to me. Could see massive drop tomorrow. Good luck and be cautious. This is based off my opinion and analysis.

META - Melt up & Crash series [1] Hard to get a read on META as I am not 100% confident with the channel. It could break the top rail to the upside to form a double top or new high, before crashing down - or retest the upper rail to reconfirm the channel as resistance before continuing down.
All I expect is if it breaks the orange bottom rail, the crash is due.
Not financial advice.


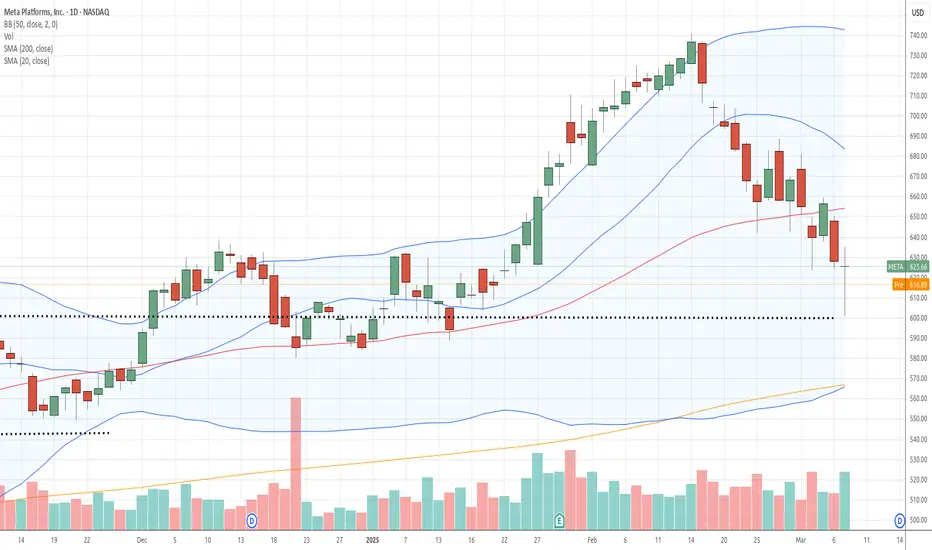
META (Daily) - Anchored VWAP Test at 613 Incoming?META has experienced a strong upward move but is now showing signs of retracement. Price has broken structure at the highs, and we are now seeing a pullback into key levels of interest.
The anchored VWAP from the most recent swing low suggests a potential test around 613, aligning with previous demand zones and trendline support.
Volume profile analysis indicates strong liquidity around this level, which could act as a key reaction zone.
If 613 holds, we could see a bounce back toward previous highs; however, failure to hold may open the door for further downside towards deeper demand levels around 560 and below.
Watchlist:
Bullish Reversal: Look for volume confirmation and bullish reaction at 613.
Bearish Breakdown: A close below 613 could signal continuation lower into deeper demand zones.
📈 Trading Analysis - Meta (Months Chart): V Bottom Pattern Hello traders, I hope you had a great weekend.
Today, let's focus on Meta as a compelling price action reversal pattern, the V-bottom, has emerged. Upon analyzing the monthly chart, it's evident that a V-bottom pattern has developed, suggesting a potential price reversal. The price has successfully broken above the breakout point at 383.72.
For those with an appetite for aggressive trading, entering the market during trendline breakouts at the base of the V-bottom pattern is an option. However, it's important to note that straightforward trendline breakouts have a success rate of only 52%.
Now, if the price manages to sustain itself at the 38% level, specifically at 496.79, there is a possibility of a retracement back to the breakout point. While not guaranteed, such a retracement could offer a potential long entry opportunity. With a success rate of more than half, the price might target the 62% level at 567.95 and the 79% level at 617.20, sooner or later.

META - "Enemy of the people" is Bullish or Bearish? hmm "Trump calls Facebook the enemy of the people. Meta’s stock sinks."
• Meta Platforms' Chief Legal Officer Sells Shares
Im just going to guess this may or may not be bad news. Should be an interesting ride.
Think we can hit my targets? GL!

Meta - The Breakout Is About To Be Confirmed!Meta ( NASDAQ:META ) is attempting the breakout:
Click chart above to see the detailed analysis👆🏻
Over the past couple of months, we have been witnessing an incredible rally of about +750% on Meta. Looking at the long term reverse triangle pattern, this rally was not unexpected and such is the breakout. We still need to see confirmation, but then Meta will target the four digit level.
Levels to watch: $700, $1.000
Keep your long term vision,
Philip (BasicTrading)


$META 50 EMA level held twice possible double bottom bounce hereNASDAQ:META stock held 50EMA support level bouncing twice below that level. Looks like possible double bottom of 643 level. Seeing some call flow coming in as well on Friday. Looking for calls about $670 for a move towards $685 and $700.

Meta (META) Scalping Strategy🔥 Market Overview:
Trend: Short-term recovery, but overall structure is fragile.
Key Levels:
Resistance: $677.00, $685.00
Support: $672.00, $665.00
Indicators:
EMA9 near EMA200 → Price is testing key levels.
MACD slightly negative → No strong momentum.
RSI at 53.50 → Neutral, no strong divergence.
Risk of Short Squeeze? Low—needs a breakout above $677.00.
Market Maker Activity: Some accumulation, but not a confirmed reversal.
🔥 Scalping Strategy:
🩸 1. Momentum Scalping (If Breakout Above $677.00)
Buy near: $677.10
Target: $685.00
Stop-loss: $675.00
Risk-to-Reward: 1:2
🩸 2. Range Scalping (If Price Holds $672 - $677)
Buy near: $672.00
Sell near: $677.00
Stop-loss: $670.50
Profit Potential: ~2.5%
🩸 3. Breakout Scalping (If Below $672.00)
Short below: $672.00
Target: $665.00
Stop-loss: $674.50
Risk-to-Reward: 1:3
🔥 Mid-Term Trend Forecast (1-3 Weeks):
If $677.00 holds, Meta could push towards $685.00 - $690.00.
If $672.00 fails, expect a drop to $665.00.
🔥 News & Market Context:
Judge ruled against Meta in an H1-B visa lawsuit → Minor bearish factor.
Stock up 2.46% today → Short-term bullish momentum.
Earnings in 56 days → No immediate catalyst for a big move.
👑 Trade Rating (1-10):
Range Scalping: 7/10 (Good but needs confirmation).
Momentum Long Above $677.00: 8/10 (Breakout setup).
Short Below $672.00: 9/10 (Best risk-reward setup).
🔥 Decision:
🩸 Short-term Play: Range scalping $672 - $677 until a breakout.
🩸 Mid-term Play: Break above $677.00 = long; below $672.00 = short.
🩸 Ideal Play: Watch for price reaction at $677.00 before committing.
👑 Final Verdict: Patience—wait for a confirmed direction.
🔥 LucanInvestor's Quote:
"Strategy beats emotion—execute with discipline."

Meta puts Potential Dead Cat BounceI'm looking to get into some metal puts around 686 as you can see on the chart that I'm just waiting until price get into this supply zone so just know that this is a technical play nothing else I don't look at news I don't look at fundamentals none of that matters to me I only look at technical analysis this is a technical play i'm getting into 630 puts so if you want to follow me you can I'm posting this way early again if you see a lot of grammar hours it's because I'm doing voice to text and I'm not going back to check the grammar so look at the play and laugh at the same time

Probably A StarMETA is running since August without a major correction. It is time to, isn't it?
If this week will end tomorrow without a new high and perhaps the star will remain to shine we may see even a major downward correction.

META priced the new Channel Up bottom. Eyes $800 next.Meta Platforms (META) hit yesterday its 1D MA50 (blue trend-line) for the first time since January 02, while reaching the bottom of the short-term (dashed) Channel Up and the 1D RSI the November 15 2024 Low.
Since the 2-year pattern is also a Channel Up, this pull-back is a natural technical correction before the next Bullish Leg. Both previous rallies that started after long-term Accumulation Phases, then rallied by at least +45.10%.
As a result, we treat this correction as the most optimal medium-term buy opportunity to target $800 (top of dashed Channel Up and +45.10% from the Accumulation Phase bottom).
-------------------------------------------------------------------------------
** Please LIKE 👍, FOLLOW ✅, SHARE 🙌 and COMMENT ✍ if you enjoy this idea! Also share your ideas and charts in the comments section below! This is best way to keep it relevant, support us, keep the content here free and allow the idea to reach as many people as possible. **
-------------------------------------------------------------------------------
💸💸💸💸💸💸
👇 👇 👇 👇 👇 👇
