TGT trade ideas


TGT: Bullish Breakout on Seasonal Holiday EarningsTarget showed me all the ways to make money today. I took a small scale in a few days ago anticipating a good response to holiday earnings after they had a relatively lukewarm rebound from the late 2018 correction. Seeing the traffic at my own local Target, I was certain they would exceed expectations and they lived up to my hopes and more. After hours trading today was slightly down, but I expect this as some long term HODL'ers are finally realizing some profit, so there will be probably be more attention and buying for this household brand. I'll scale in and gradually ease my stops up to retain made profits at it rises. The profit taking found plenty of willing buyers, though, with the chart showing a black hammer doji that's a mild bullish signal with breakout confirmation needed in the coming days.
For technicals, a MACD has been positive but flat for some time with the histogram only now breaking out bullish. ADX is low but pulling upward suggesting a coming upward price trend with DI+ above DI- for a few weeks and diverging strongly with DI- crossing below ADX as a potential buy signal. RSI is breaking above 60 but still below 75 so there's still time to hop on board if this only going to be a short lived price trend, but this shows signs of a contrarian pull back upward from the trough of the recent market wide corrections.
This is likely to run up to 80 before really hitting it's first major resistance level and onward to 88 if it can sustain upward momentum long term. Expect a stair stepping pattern upward as well as watch close competitors like KSS and WMT and GPS and others to gauge sector and industry correlation.

Bearish TGTThis chart has some technicals suggesting an extended move lower is likely ahead. A break below the trend line could suggest a visit to the 59.20 level. It would be difficult to be long this stock at this levels...


TGT - Dancing at Resistance Even after a crazy week target is dancing around the resistance line. I believe it will continue to follow the downward channel, therefore this week I am planning to buy some put options.


TGT, BBY Earnings: Retail Brick & Mortar Topping Patterns Target and Best Buy reported earnings today and their stock values fell, TGT worse than BBY. The retail brick and mortar stores are the last group to report each season. The ubiquitous AMZN has put most of this type of store at risk of total displacement as consumers prefer the ease and speed of online shopping over driving to a store.
Technical patterns are even more important in a downtrend as the 3 primary market participant groups that sell short are technically oriented rather than fundamentalist or emotional buyers or sellers. Study both weekly and daily charts before you choose stocks to sell short, in order to calculate potential support bounce levels, and to anticipate how far a stock can drop.
This is one of the newer topping formations that developed in the past few years as the market became fully automated for the Institutions.

updateGreen zone a key level to watch in TGT. I expect the price to react strongly (either up or down) when reaching this zone. Wait for price to react before making a trade or be sure to use stops based on your own risk tolerance.

$TGT INSIDE WEEK AND DOUBLE INSIDE DAYMONTHLY CHART BEARISH
WEEKLY CHART INSIDE
DOUBLE INSIDE DAY
MONTHLY CHART TELLING US TO FAVOR SHORT
PREFER A GAP UP TO SHORT ON WEAKNESS
WILL PLAY EITHER SIDE THOUGH


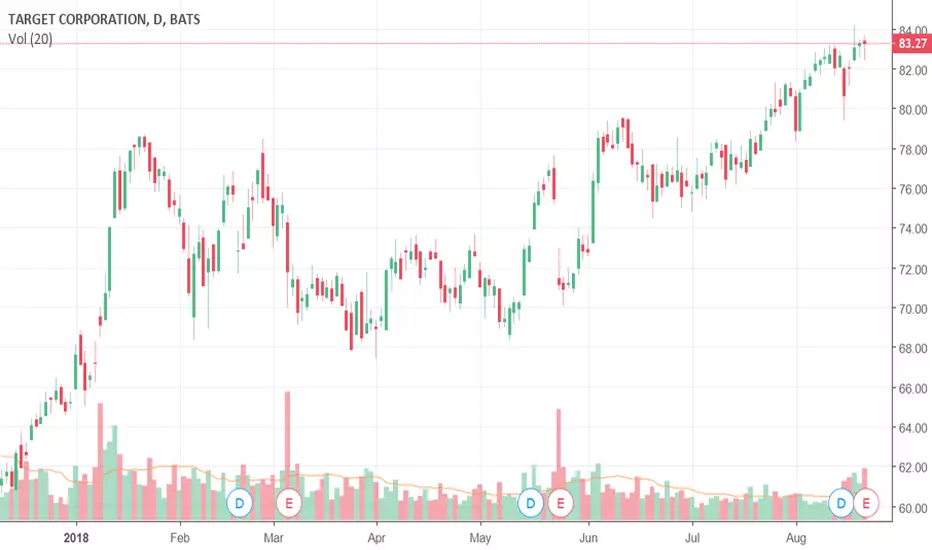
Target (TGT) earnings: revenue growth accelerating or not?Target Corporation (TGT) shares are trading at 83.27. The company is scheduled to announce its second-quarter results on August 22 before the opening bell. What's driving TGT stock price? What's TGT stock price forecast?
Analysts are keeping an eye peeled for market share gains after strong Walmart results last week.
Target is an iconic brand that's under threat from considerably larger and more powerful competitors Amazon and Walmart. The company differentiates itself through signature categories (apparel and wellness) that carry higher margins and faster growth rates than other areas of its business.
www.finstead.com


TGTNow price is in the range between levels:
supoort level @72.45
resistance level @73.21
Enter if m15 hold above 73.25
Stop: 72.36
Target 1: 74.4
Target 2: 74.98

short TGT - Short Term TradeI have bought the puts for TGT ending next week. This has been falling for the last 2 days on decent volume.
My tgt : 75
SL : 78

