$BEAM future doom or gloom?Take a look at $BEAM. Looking for an opportunity to add to my spot bags. Interested to see if it pulls back to a 618 on the one hour. I have heard decent projections for this token from several different crypto guru's. What are your thoughts?
BEAMUSDT.P trade ideas

BeamX chartThis is a chart using a method inspired by Da Vinci.
The circles are price targets and also these act like support and resistance trying to contain the price inside until it breaks out on the up side or down side. Also the diagonal lines are trend lines and they act the same.
This is not financial advice.
I can teach the method for those who see the benefit of it.

Beamx chartBeamx chart Price is contained in the yellow sideways cell, that acts as a chop zone. Once the price leaves that area and breaks the blue level it has a chance of going bull to T1. If the price breaks under the yellow cell, the higher chances are that the price will go to T1 bear.
This is done using an experimental method that I developed based on Da Vinci.
This is not financial advice.

BEAMX buy/long setupAfter the heavy drop, it has now broken the trigger line and created a bullish iCH.
There is a support area close below the price, on which we will look for buy/long positions if the price reaches this range.
The targets are clear on the chart.
Closing a daily candle below the invalidation level will cause analysis.
Note that the financial market is risky, so:
Do not enter any position without confirmation and trigger.
Do not enter a position without setting a stop.
Do not enter a position without capital management.
When we reach the first TP, save some profit and try to move the stop continuously in the direction of your profit.
If you have any comments please post them, comments will help us improve our performance
Thanks

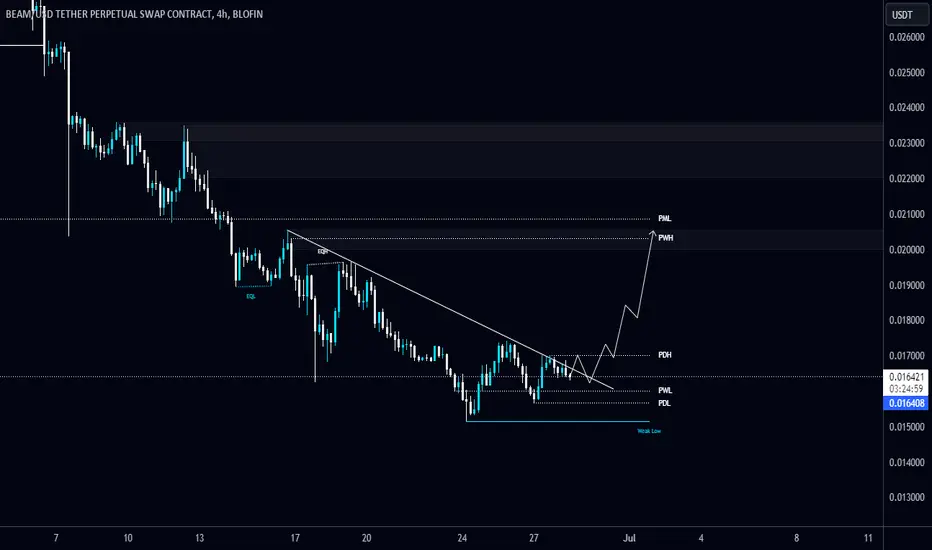
#BEAM/USDT is rejecting from Diagonal Trendline in 4-Hour TF!#BEAM/USDT is rejecting from Diagonal Trendline in 4-Hour TF!
Wait for Trendline breakout to open a long position. NASDAQ:BEAM is holding PWL $0.016 as a support level. The local resistance level is $0.017.
BEAMX 13% UP AND MORE TO GOBEAMX previous trade idea was given and it did 13% pump and more to go from here.

Beamx can do 2x from hereBeamx coin is very best coin to buy now in spot which can go 2x easily from here.

BEAM - trading setupWe're going to try this one on BEAM for a possible short-term scalp. We grabbed the liquidity and surged 80% in just two weeks. We believe the bullish pattern should continue and move higher. This coin is highly volatile, so don't forget to use a hard stop and make sure to take profits on the way up if it hits. 🤝

Long signal for BEAM/USDTThis technical analysis is based on the daily chart of BEAM/USDT on the Bybit exchange. This analysis draws two price channels and evaluates support and resistance levels.
Price Channel Analysis:
The previous bearish channel is broken out, and a bullish channel is formed.
The suggested entry point is around 0.027905 USDT.
Entry and Exit Points:
Entry: 0.027905 USDT
Take Profit: 0.036855 USDT (32.08%)
Stop Loss: 0.025362 USDT (9.10%)
R/R Ratio: 3.53
Conclusion:
This analysis suggests that by adhering to the specified take profit and stop loss levels, a successful trade can be achieved. The Reward/Risk Ratio for this trade is approximately 3.53, indicating a highly favorable risk-to-reward scenario. To manage risk effectively, it is recommended to strictly follow the stop loss level.

BEAMUSDT | SWING TRADE (FALSE BREAK)Yesterday, BEAMUSDT saw the bulls making a bold attempt to break the 8H high with impressive volume, only to face a swift rejection on the second candle—classic false break! Using my trusted false breakout strategy, I set my order at the previous 8H high with a 1.5 ATR, targeting the 4H low.
With the weekend approaching and volume likely to dip, it's a thrilling setup to watch. Will the trade hit the target or hold steady in the low-volume weekend? Stay tuned for the outcome!

I hope this idea is the best I have publish so far,up2 40%profitI hope this opinion is the best I have offered so far, with up to 40% profit.
Through technical indicators, I have suggested three entry points. I admit that I tried to make them two entries, but I could not. Therefore, the suggestion will be to enter in three stages for the medium-term trader. If it's scalping, entering in five stages might be better, between the first and the last.
Exiting in two stages, each stage 40% of the trades. Note that I will keep 20% for the long term.
Remember that this is my opinion and not financial advice at all.

BEAMX LongRejected 3 times from green box previously but finally managed to flip it into support.
Breakout retest of trendline + retest of green box successful.
targets marked.

BEAM a perfect cupnhandle. Free trade from my PlaybookA cup and handle( CNH ) is a continuation pattern!
The psychology is that of a rounding bottom accumulation and rejection at prior resistance, without taking out that resistance, so that there are still shortstops at that point.
You then try to buy the higher low on whatever timeframe the CNH is most clear and retracement should never be much more than the FIB 382.
You scale into your trade towards the four hour EMA12 .
And you let her in a few orders and your stock goes below the 382 with a little bit of wiggle room
This is a very basic continuation play
It's one of the few continuation plays that I use , as I mostly use aggressive pullback trades.
The great thing is you immediately stop out for tiny loss , if it does not become a cup and handle. It would then likely become an equilibrium pattern and then you want to stop out and reevaluate. You don't want to be laddering down. Been there done that its not worth the effort.
Be Strong Minded and Enjoy the Process! The Money follows the Strong Mind and Good Consistent Actions.


Beam breakout Break breakout from his multi week horizontal nd trend resistance
This will fly now gaming narrative is also strong in this cycle
Perfect risk to rewars ratio

BEAMX - Daily Shortterm Trend & Support/Resistence Trade SignalBEAMX now completed a correction and are ready to return to gain higher.
The new opportunity at the current price
🟢 Trend: Bullish 🚀
🟢 Support: $0.019
🟢 Target: $0.06
------
Current: $0.025

BEAM Bullish descending wedge, Strong supportBEAM Bullish descending wedge, Strong support. Long PT around 80% up. Graphics illustrating.

📈🔍 BEAM Long Trade Analysis 💼📉Trade Overview:
BEAM presents a potential long trade opportunity, characterized by higher risk. Therefore, it's advisable to allocate only a small portion of capital to this trade.
Trade Setup:
Entry: Enter the trade between $0.022 - $0.024.
Take Profit: Target $0.033 - $0.034 and next resistance area at $0.039 - $0.040.
Stop Loss: Set just below $0.0215 to manage risk.
📊🚀 Exercise caution and monitor BEAM's price movement for trade execution! #BEAMTrading #CryptoAnalysis 🌐💰

Technical Analysis Suggests Imminent Price Surge for Beam CoinThe recent technical analysis indicates that the price of Beam Coin could surge in the near future. Examination of various indicators such as the MACD and RSI reveals a promising development pointing towards an upcoming uptrend. Considering the past analysis, which showed similar positive signals, confidence in an impending price surge for Beam Coin strengthens. Given these signals, it's likely that Beam Coin will experience a significant price surge in the coming days or weeks. It's advisable to closely monitor market conditions and identify potential entry points to capitalize on this anticipated upswing.

BeamX 1D AnalysisPrice has been following basic supply and demand structure downwards (RED path)
in the coming 6-8 days im expecting price to creep up towards red dotted line.
If we break market structure and flip red dotted line into support we should push up further, consolidate before going higher(GREEN path)
Im excited to see how the coming weeks play out.
Consider long position target approx 0.029-0.032
Pair analysis with overall market analysis before making any moves.

BEAM/USDT LONG!!!Beam rompeu uma ltb, com rsi xtremo no 1h. Beam teve forte recuperacao apos o diario ficar extremo.

Beam $Beam #Beam Beam is a perfect example of why you look at things on multiple time frames before you just make a quick decision on if something looks good or bad from just one point of view. It has had a rather deep correction and still could go lower. However, if you really understand the project as well as the type of heavy influencers it has behind it. It should be a somewhat easy buy/DCA at these levels especially if you have no exposure yet to it. most think it is going to be 20-50x + from this level by the end of this cycle. It also is a Gaming project that could end up being one of the few that ends up with real world utility proving that it ends up if not this cycle, then maybe the next. Being immune to Bear winters in the way other projects get. Not sure what you know about gamers, but they don't operate in 4-year cycles, lol these guys play 24/7365 and often even more during holidays.
Regardless of if it goes lower or not IMO these are good entries to begin with for future gains.
As for the charting shared and my indicators you can see that it looks a lot better on the daily then it does on the weekly which clearly has a strong sell signal currently. However i feel the daily looks close to throwing up a BUY signal and it could be about ready for a decent bounce even if just temporary. Only you know what your time horizon is and if you're trying to invest in your future and or make a swing trade vs a day/short term trade.
IMO Don't sleep on BEAM
If you ever wanted to follow early to accounts that stay in the game and up with what's going on and wish you made a appearance with them prior to them being bigger followings etc. this is a great opportunity lol with me, my larger OG account I've spent the last several years and all through the bear building was killed by X and now I'm starting over from scratch.
I've purposely given you the same chart and layout but on two different time frames to help newer traders coming into this cycle see how different things can look on a daily vs a weekly time frame.
I think that this can really help speed up learning for many and to open their minds to variables.
As you see the daily can easily in this case look much more instantly bullish and give you the greater feeling of FOMO #Fomo to jump in. Whereas the weekly can give you more of a tactical view and help with your approach being so.
Hopefully some of you find this chart helpful during this stressful pullback/flush that I'm aware has really beaten down and or killed many portfolios for traders.
I've fallen off on posting/sharing my charts these last few months while I was trading ALOT myself and on multiple platforms and various ideas. However, during these more stressful times I will try and stay more active with updating what community I have.
For my birthday without cause or warning X shutdown my larger account @RareBreedOG so I'm starting over fresh with almost no followers now for the algorithm. That being said I would greatly appreciate help with you hitting the like /Follow/share buttons as much as possible if you find these charts helpful at all or even just want to help me rebuild my following after getting Fu**ed by X. For this reason, I don't plan to pay for a checkmark this time around either, but you can all help give me reason to keep sharing and not just leave to other platforms.
Everyone stay safe and trade wisely and be careful with leverage in these uncertain times.

BEAMX inteligentassetBullish scenario
Resistances 0.0326 in 50 ema, 0.034, 0.039 pivot high, 0.042, 0.048 upper limit channel
Bearish scenario
Supports 0.0296 lower limit channel, 0.0283 pivot low, 0.024, 0.0169
