The latest analysis of Bitcoin is in a downward channelBTC is currently trading within a well-defined descending channel, showing consistent lower highs and lower lows since mid-March.
Descending Channel: The upper and lower boundaries have acted as reliable resistance and support zones.
Double Bottom Pattern: Price action recently formed a double bottom near the $75,000 zone (marked "HUNT2"), which is typically a bullish reversal signal.
Breakout Target: The neckline breakout from the double bottom targets the $85,000–86,000 zone, which aligns with the upper boundary of the channel — a confluence resistance.
Fakeouts (HUNT1 & HUNT2): These "hunt" zones likely represent liquidity grabs or stop-loss sweeps, indicating strong institutional manipulation before major moves.
Bullish Scenario: After touching the lower level of the neckline, it goes to touch the top line of the channel and touches the target of the pattern.
.
Bearish Scenario: Rejection from the $85K zone could send BTC back down toward
73K
–$ 74 K. Further downside could bring the $69K–$70K zone into focus.
BEARUSD trade ideas

$BTC long term projection $129k-$137k top, then down to $20ksHere's a chart of my cycle projection of bitcoin. I think it's likely that we find support in the $60k region over the next couple of weeks and then continue the bull run up to $129k-$137k.
In terms of gains from here, I think BTC is only a 2x, however, I think we're going to see our biggest altcoin run since bitcoin's inception.
After we hit the top, I think we'll make a very large correction back down to the $20k region (supports on the chart) before the next long term cycle begins.
This is the final wave of the first cycle of bitcoin.
Lots of money to be made.

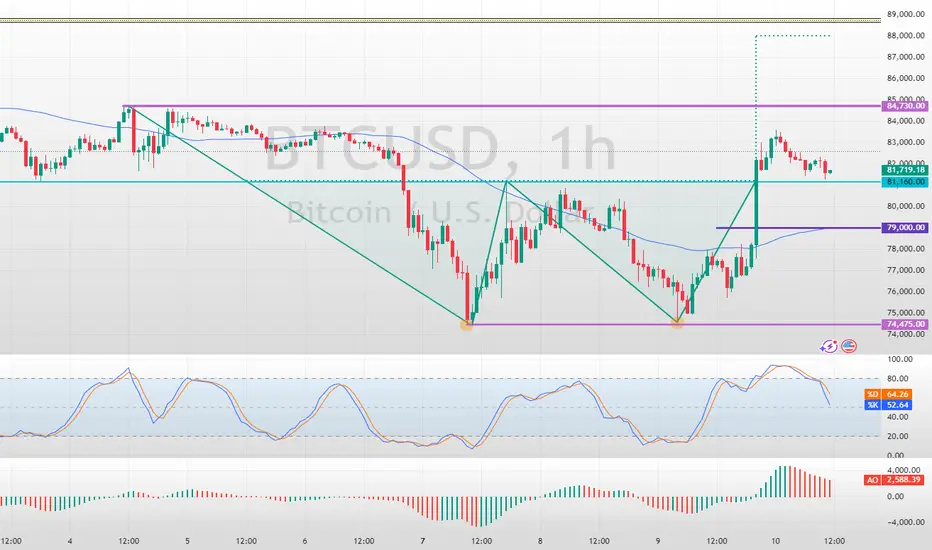
Bitcoin Double Bottom Pattern Came into PlayFenzoFx—Bitcoin jumped upward from $74,475 support as expected due to the formation of a double bottom pattern on the 1-hour chart, which is a bullish signal.
As of this writing, the price is stabilizing and testing the $81,160 mark as support. However, the 50-SMA on the 1-hour chart serves as the pivot point between the bull and bear market.
The next bullish target could be $84,730, followed by $88,000 if BTC holds above the discussed moving average.
Trade BTC/USD Swap Free at FenzoFx Decentralized Broker
Bitcoin bearish cup and handle
Bearish cup and handle drop towards 72000 0.618 fib level. It failed to reject and stay above 79000 0.5 fib level twice suggesting a drop to the deeper fib level is likely.

BTC Today's strategyCurrently, BTC is fluctuating upwards within an ascending channel, which closely resembles its price movement that began on March 10th. This suggests that, barring significant changes in the market environment, BTC prices are likely to continue their upward trend and move towards higher price ranges in the near future.
Meanwhile, investors should closely monitor various risk factors that could impact the market, such as changes in regulatory policies and fluctuations in the macroeconomic landscape, and adjust their investment strategies accordingly.
Buy@ 83,500 - 84,500
tp: 86,000 - 87,000
Hope this trading strategy is helpful to you. If you have different opinions, your feedback is most welcome.

BTC USD Elliott Wave AnalysisHello friends
Especially those who are new members (welcome)
In the digital currency Bitcoin, after a sharp rise and the formation of a range zone, we saw a drop in the price of Bitcoin.
Today we want to check whether this drop continues or not?
If the answer is yes! How far?
We see a corrective pattern on the daily timeframe.
This pattern is flat with a long wave C.
The structure of this pattern is 3-3-5.
Wave C is 5 waves. Now we are in wave 5 and we are waiting for a slight increase in the price to the $ 86,500 area and then the price will drop to the $ 73,500 area.
This area is a static support and we expect a reaction at this price.
Good luck and be profitable.

BTC/USD more sells incoming? 66k?!Good morning traders, I’m back again with another beauty guys!! I’m sure everyone is asking what’s happening in the markets recently, well Trump(era) is happening.
Back to the charts, here I have a 1 hour TF, yesterday we saw very big moves in price following the news that the tariffs are on hold, but that doesn’t or shouldn’t take always our market sentiments and our biases we had coming into this new week.
This setup is basically a continuation set up but for now I’m only focusing on the relative equal lows because we understand that’s there is sell stops resting below those lows. For the rest of the day we can expect price to deliver lower price for the rest of the week but my question is this…can price drop to the 66k level?
Good luck traders and remember we study price and time not technical analysis!

BEARISH BIASPrice broke daily structure earlier, now pulling back up to fill liquidity at the daily previous supply region. Expect bearish movement to commence when upper liquidity have been fully swept.
It's goung to be a big sell down to 70k or below it.

Hidden Bullish DivergenceMonthly Closing above
75000 would be a +ve sign.
Hidden Bullish Divergence on Daily TF
has also appeared.


BTC at Turning Point Will Bulls Push Toward $90K or Face Reject?1. Current Price and Trend
Current BTC/USD price: $83,452
Price change: -$234 (-0.28%)
The recent trend shows a recovery attempt from a local bottom around $79,150.
Price appears to be testing resistance and forming potential higher lows, indicating possible bullish momentum.
---
2. Supertrend Indicator (10, 3)
The red line above the candles suggests the Supertrend is bearish at the moment.
A break above this red line would be considered a bullish signal.
---
3. Key Support and Resistance Levels / Take-Profit (TP) Targets
Labeled on the right:
TP1 (Support/Resistance): 85,000
TP2: 88,000
TP3: 89,100
TP4: 89,380
TP5: 90,000+
Each TP level represents a potential resistance zone where the price might face selling pressure or pause.
---
4. Chart Projections
Two possible paths are drawn on the chart:
Bullish scenario (blue path): A breakout above resistance levels leading to targets up to TP5 ($90K+).
Bearish/consolidation scenario (red path): A sideways movement with possible dips before a breakout or further rejection.
---
5. Sentiment
The inclusion of U.S. news/events icons near the recent low suggests that macroeconomic factors (possibly USD-related) may have influenced the recent dip.
Price action shows consolidation and a possible reversal pattern (e.g., double bottom or ascending triangle).
---
Conclusion
BTC is at a critical juncture, testing lower resistance near $85K.
A breakout above $85K– FWB:88K could accelerate a move toward $90K+ (TP3 to TP5).
A failure to break resistance may lead to continued sideways or bearish movement.

BTCUSD swing shorts setupBTCUSD has been trading within a tight consolidation range on the daily timeframe, indicating market indecision and potential buildup of liquidity. After this extended period of sideways movement, we anticipate a bearish breakout as the market seeks to sweep liquidity below the current range.
Price has failed to make a strong higher high, suggesting weakening bullish momentum. If BTC breaks below the range support and confirms with a retest, this could be a strong signal for short entries. Key support levels and order blocks should be monitored for confirmation.
Confluences for the short bias:
Loss of bullish momentum on daily candles
Liquidity resting below the consolidation range
Potential break of market structure
Bearish divergence on RSI (if applicable)
Proximity to a key resistance zone or supply area

Bullrun is Still Here, $120,000 - $130,000 Soon?The price drop over the last 2 months from $109,000 to $74,000 has made many people think the bull run is over or that the cycle has ended.
But if we look closer, this move appears to be just a correction. The price structure is still forming higher lows and higher highs — a clear sign of a bullish trend.
Will it form another higher low between $77,090 and $73,808?
This is the real question, because it will determine whether the bullish trend is still intact.
If you notice, during the drop from $109,000 to $74,000, the stochastic indicator didn't make a lower low. That suggests the decline wasn't supported by momentum — a positive sign, as it shows buyers still have strength to push the price higher.
From a price action perspective, $88,624 is a key confirmation level. If the price breaks above it, there's a high chance we’ll see a new higher high, surpassing $109,000 and targeting the $120,000–$130,000 range.

Bitcoin (BTCUSDT) – Technical and Fundamental Analysis 1DBTC has formed a falling wedge pattern on the daily chart, indicating a possible bullish breakout. A clean break above the 0.618 Fibonacci level at $86,485 may trigger an impulsive move to the upside. Price is bouncing from wave (4) and challenging the descending trendline. RSI is recovering, suggesting renewed buying momentum, and MACD shows signs of a bullish reversal.
Fundamental Factors
Bitcoin remains supported by strong institutional demand and optimism around crypto ETFs. Expectations of lower interest rates and macroeconomic uncertainty continue to drive interest in BTC as a hedge. Meanwhile, on-chain data reflects accumulation, with exchange outflows increasing in recent sessions.
Scenarios:
Main scenario – breakout above 0.618 targeting $96,595 and $109,474, with a potential extension toward $125,842.
Alternative scenario – pullback toward $79,384. If this level fails to hold, further correction to $72,283 and $63,497 is possible. The $79K level remains a key support for bulls.

BTCUSD BUY ANALYSIS SMART MONEY CONCEPTBTC/USD is consolidating just above a major supply zone ($82,731 - $83,500), showing strength after a bullish breakout earlier this week.
Key Levels to Watch:
Resistance Zone (Supply): $82,731 - $83,500
Price is currently testing this zone. A clean break and hold above it could trigger a sharp upside continuation.
Immediate Demand Zone: $79,709
This level previously acted as strong resistance and now flipped into support. If price pulls back, I’ll be watching for bullish price action around this zone.
Major Demand Zone: $75,701 - $76,811
If price dives lower, this zone is likely to see heavy accumulation based on past reactions and volume profile support.
Why It Matters:
Price is respecting key supply and demand zones generated by the LuxAlgo Visible Range tool.
Bitcoin has formed a strong impulse leg upwards, followed by a potential bullish flag formation at resistance — a classic sign of continuation.
Multiple rejections from demand zones show strong buying pressure on dips.
Trade Idea:
Bullish Bias: As long as BTC holds above $82,731, I’m expecting continuation towards new highs.
Entry Zones: Watching for long opportunities on bullish confirmations at either $79,709 or $75,701 (marked by green arrows).
Invalidation: Clean break below $75,701 could flip the bias short.
Like this setup?
Smash that boost, drop your thoughts in the comments, and don’t forget to follow for more institutional-grade supply & demand analysis!
#Bitcoin #BTCUSD #CryptoTrading #SupplyAndDemand #LuxAlgo #PriceAction #CryptoAnalysis #TradingView

BTCBTC building a picture perfect distribution, which is a bearish pattern.
I will sell all my BTC once it reached the "sell zone".
A huge correction is about to come soon, new buy opportunities will come.
Have a good time! 🤝

BTCUSD Market Discrepancy Analysis (April 11, 2025)
📉 Chart Overview:
The chart reflects Bitcoin (BTC/USD) on the 1-hour timeframe, with significant price movements between 77,417 (support) and 83,846 (resistance). The asset recently rallied to fill a Fair Value Gap (FVG) before facing resistance and dropping back to retest the lower region.
1. Resistance Rejection at $83,846:
- The price spiked aggressively into the resistance zone, but quickly reversed after failing to sustain above it.
- This price rejection is clear evidence of strong seller presence.
- The FVG zone just below the resistance appears to have been filled, triggering a sharp correction.
2. Failed Breakout or Bull Trap:
- The s…
- This suggests that buying pressure was temporary, and mostly driven by short-term momentum traders rather than real demand.
4. Incomplete Fair Value Gap at77,417:
- Price moved sharply down and almost touched the FVG area near 77,417, but did not completely fill it.
- This leaves an imbalance and suggests that the market may revisit this area to fully mitigate it.
5. False Break of Lower High:
- The high near 82,290 was breached temporarily, but price did not close above convincingly.
- Indicates a fake breakout structure within a broader bearish context.
---
🔧 Technical Summary:
| Zone | Level | Status |
|------------------|-----------------|-------------------------|
| Resistance | 83,846 | Rejected |
|…
This chart shows a clear discrepation between price momentum and volume confirmation. While price temporarily surged into a resistance zone, it lacked the strength to hold above key breakout levels, suggesting the rally was unsustainable.
> The Fair Value Gap (FVG) at77,417 remains unfilled, and current price structure points to a potential return to that zone. Expect bearish continuation unless BTC reclaims and sustains above $82,290 with volume.
---
Let me know if you want this in a simplified caption format for social sharing!

BITCOINBearish BTC: Speculators are heavily shorting Bitcoin (bearish COT), the market structure shows lower lows and lower highs, and intraday momentum is bearish, indicating continued downside pressure.

* BTC Elliot Waves Update: 2 scenarios *Hello again degenerates,
I promise you i am trying to make shorter videos hehe, but in this video I had to explain 2 scenarios that I can see happening, I give you some insight on what to be careful on both scenarios, and I go back to our SPY chart to do a quick review of how it support our scenarios.
Let me know what you think!

BTC BULLISH RUNBTC'S BULLISH RUN IS BACK ON. The price has been dumped down to trap traders, stop hunt, and liquidate long buyers. I created a three-stage process to analyse the markets. The Jan trading range trapped traders above and was dumped down for three months, FEB,MAR, and APR. This is causing FUGAZI in the market!

BTCUSDBitcoin has got high support around 75,000 and we are expecting it to start it's bull run very soon as it breaks it's current trend. targets are given based on the analysis.
By sharing your ideas in comment will help us understand financial markets better...

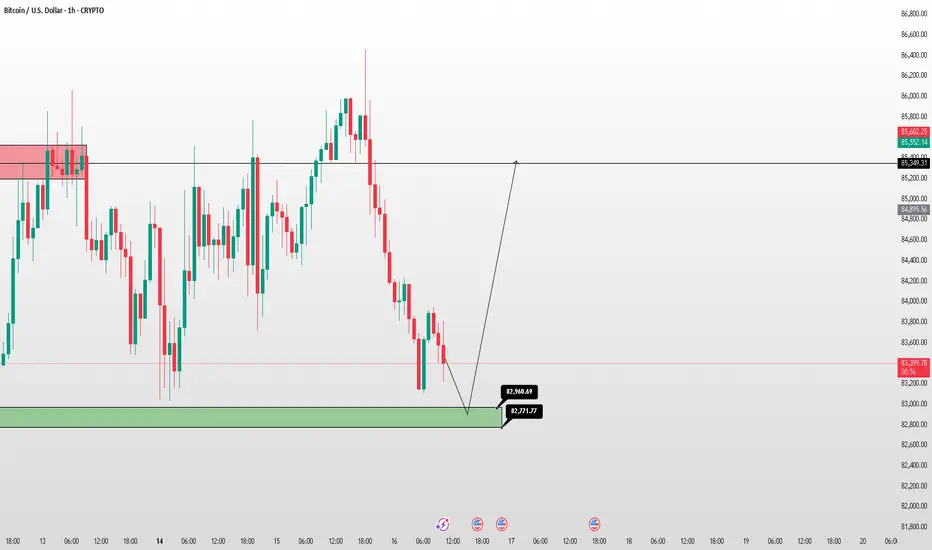
BTC/USD – Buy Setup🚀 BTC/USD – Buy Setup (April 16, 2025)
🔹 Demand Zone: 82,771 – 82,960
🔹 Take Profit: 85,349
⚡ Rules:
Buy if price reaches 82,771–82,960.
Stop Loss: Below 82,700.
Hold until 85,349 (or scale out).
#Bitcoin #Trading #Crypto #FXF #FXFOREVER
$BTCUSD analysis and price targets and a look into my reasoningBITSTAMP:BTCUSD HEY YALL *DISCLAIMER NOT FINANCIAL ADVICE
A little view into my technical analysis and why imo the floor is in for CRYPTOCAP:BTC
