CHECK BTCUSD ANALYSIS SIGNAL UPDATE > GO AND READ THE CAPTAINBaddy dears friends 👋🏼
(BTCUSD) trading signals technical analysis satup👇🏼
I think now (BTCUSD) ready for(SELL)trade ( BTCUSD) SELL zone
( TRADE SATUP) 👇🏼
ENTRY POINT (88900) to (88800) 📊
FIRST TP (88400)📊
2ND TARGET (87800)📊
LAST TARGET (87300) 📊
STOP LOOS (89500)❌
Tachincal analysis satup
Fallow risk management
BEARUSD trade ideas

The potential triple-top pattern of BitcoinFrom the previous chart, the price successfully broke through the upper trendline and started to rise. This could indicate that bullish momentum is taking over. Waiting for the price to break the upper trendline is a solid strategy for confirming bullish momentum. However, there is a potential triple top pattern forming, which could indicate that the price may face rejection at a key resistance level 86056.35
If the triple top pattern becomes more apparent and the price fails to break above resistance, it could signal the start of a bearish move. In this scenario, trading volume and price action around the resistance zone are crucial to observe. If volume declines and selling pressure increases, the price may drop further.

btc wOpen . bullish and not finished . watch and preparethe weekend was finished with a pump through all resistance zones. all SL accumulated, done with.
so now, bullish wOpen. too high to LONG,
a return to wOpen - sweep low - during a nice session timing, that be great.
otherwise, wait for the progress of upside and prepare to find the short entry.

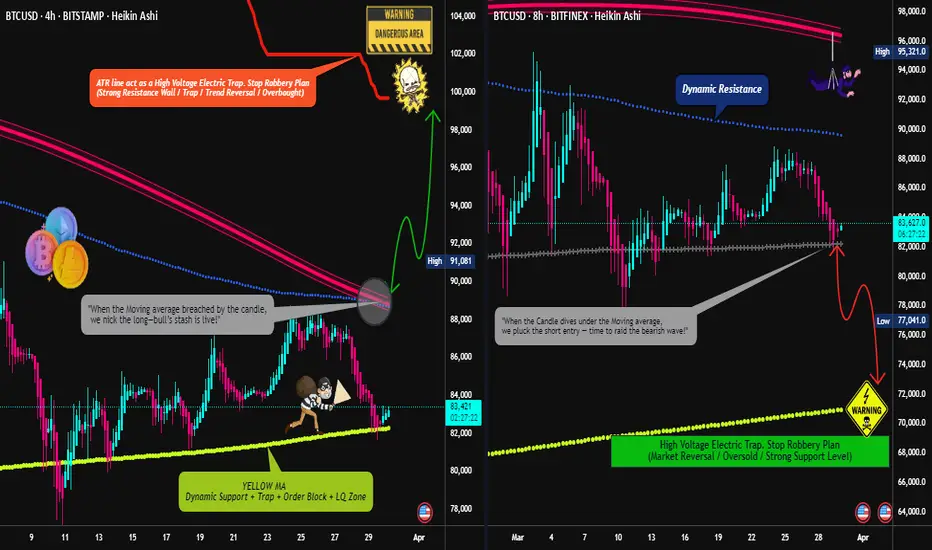
BTC/USD "Bitcoin vs U.S.Dollar" Crypto Market Heist (Swing/Day)🌟Hi! Hola! Ola! Bonjour! Hallo! Marhaba!🌟
Dear Money Makers & Robbers, 🤑💰✈️
Based on 🔥Thief Trading style technical and fundamental analysis🔥, here is our master plan to heist the BTC/USD "Bitcoin vs U.S.Dollar" Crypto Market. Please adhere to the strategy I've outlined in the chart, which emphasizes long entry and short entry. 🏆💸Be wealthy and safe trade.💪🏆🎉
Entry 📈 :
"The loot's within reach! Wait for the breakout, then grab your share - whether you're a Bullish thief or a Bearish bandit!"
🏁Buy entry above 89000
🏁Sell Entry below 81000
📌However, I recommended to place buy stop for bullish side and sell stop for bearish side.
Stop Loss 🛑:
🚩Thief SL placed at 84000 for Bullish Trade
🚩Thief SL placed at 88000 for Bearish Trade
Using the 4H period, the recent / swing low or high level.
SL is based on your risk of the trade, lot size and how many multiple orders you have to take.
Target 🎯:
🏴☠️Bullish Robbers TP 99000 (or) Escape Before the Target
🏴☠️Bearish Robbers TP 72000 (or) Escape Before the Target
BTC/USD "Bitcoin vs U.S.Dollar" Crypto Market Heist Plan is currently experiencing a neutral trend,., driven by several key factors.
📰🗞️Get & Read the Fundamental, Macro, COT Report, On Chain Analysis, Sentimental Outlook, Intermarket Analysis, Future trend targets.. go ahead to check 👉👉👉🔗
⚠️Trading Alert : News Releases and Position Management 📰 🗞️ 🚫🚏
As a reminder, news releases can have a significant impact on market prices and volatility. To minimize potential losses and protect your running positions,
we recommend the following:
Avoid taking new trades during news releases
Use trailing stop-loss orders to protect your running positions and lock in profits
💖Supporting our robbery plan 💥Hit the Boost Button💥 will enable us to effortlessly make and steal money 💰💵. Boost the strength of our robbery team. Every day in this market make money with ease by using the Thief Trading Style.🏆💪🤝❤️🎉🚀
I'll see you soon with another heist plan, so stay tuned 🤑🐱👤🤗🤩
The Black Swan Method- Making TA as a trader is like reading a magical ball but some major unpredictable events are out of control.
- i usually accurate most of the time but i should be a fool to think i am always right, it's impossible to make TA in that markets conditions.
- So this post is not to make some kind of predictions but to warn peoples on what's going on right now.
- i will try to explain very basically the situation (with my bad english skills, so forgive me if i make some mistakes) :
1/ the first attack was based on Luna and UST, some entities started to short UST/Luna with some billions $, FTX and SBF surely did it. Luna tried to save the situation with their BTC reserve but it was effortless. they lost all. (Luna have never been hacked, important to specify this )
2/ the fail of UST was the first step to create a snowball effect.
3/ 3AC, Celsius, Voyager, and much more were all involved in Luna/UST and Anchor Protocol witch was giving 18% returns on UST. They used customers funds in UST and staked, when the situation started to turn really bad for Luna, they tried to save the situation trading customers funds and they failed. (any of those companies have been hacked, important to specify this )
4/ FTX used customers funds and started to short their own products, FTT, SOL, SRM, etc , Binance saw the move and twitted that they will drop all their FTT.
FTX locked their customers wallets. FTX used 8B$ Customers funds to short markets. they are still right now trying to short USDT on Binance. (FTX have never been hacked, important to specify this).
5/ The snow ball started to be transformed in an avalanche. The damage here is huge. An exchange implosion of this magnitude is a gift to bitcoin haters all over the world.
6/ Sam bankman-fried was a Trojan horse in the crypto space, surely backed by banks and govs, a kind of worm witch have to be eradicated.
7/ Soon bankers will tell you, " u saw what happened with your exchanges ??!!, better use CDBC and stick with Banks!! ", this is their ultimate goal.
- i pray for everyone who got caught up in this mess and lost money with those bad actors.
- i hope you take care of yourself and continue to be a part of this journey.
- i hope it doesn't turn you off of crypto witch are here to stay in the future.
- BTC is resilient. No matter the magnitude of the earthquake.
- Buy BTC
- Store in Ledger, Trezor or Paper Wallet.
- Hodl and come back later.
Have faith in what you believe and fight. Thanks for reading!
PS : Not sure this post will get me banned or censored, but at this point the freedom of speech is an human right.

BTCUSDT IN A SYMMETRICAL TRIANGLE CONSOLIDATION Price formed a symmetrical triangle consolidation around the current Price of $85,189 i anticipate a bullish breakout to 86945 a buy opportunity is envisaged

BITCOIN BEARS WILL DOMINATE THE MARKET|SHORT
BITCOIN SIGNAL
Trade Direction: short
Entry Level: 85,125.88
Target Level: 75,647.52
Stop Loss: 91,444.78
RISK PROFILE
Risk level: medium
Suggested risk: 1%
Timeframe: 1D
Disclosure: I am part of Trade Nation's Influencer program and receive a monthly fee for using their TradingView charts in my analysis.
✅LIKE AND COMMENT MY IDEAS✅

Bitcoin (BTC) $95K Target? ETF Inflows & Supply Shock Key Signal
Bitcoin Flashes Bullish Signals: Record ETF Flows and Supply Shock Fuel $95K Target Hopes
Bitcoin, the original cryptocurrency, is demonstrating renewed vigor, capturing investor attention with a confluence of bullish indicators. After a period of consolidation and sideways movement following its all-time high earlier this year, recent data suggests underlying strength is building. Significant inflows into U.S. spot Bitcoin ETFs, a tightening supply on exchanges, strong relative performance against traditional markets, and key technical levels being tested are painting a picture that has analysts eyeing the next major psychological and technical hurdle: $95,000.
ETF Demand Roars Back: A Sign of Renewed Institutional Appetite
One of the most significant developments fueling recent optimism is the resurgence of demand for U.S.-based spot Bitcoin Exchange Traded Funds (ETFs). Launched in January 2024, these products marked a watershed moment, providing traditional investors with regulated and accessible exposure to Bitcoin. After an initial explosive launch, inflows moderated. However, recent weeks have seen a dramatic turnaround.
Reports indicate that these ETFs recently experienced their largest single-day net inflows since their early days in January, signaling a powerful return of institutional and potentially broader retail interest. This influx of capital into regulated vehicles is crucial. It represents sticky, long-term demand rather than just short-term speculative trading. Each dollar flowing into these ETFs effectively removes Bitcoin from the readily available market supply, contributing to a potential supply squeeze.
This sustained demand has also propelled Bitcoin's overall market capitalization significantly. While direct comparisons fluctuate daily and depend on methodology (e.g., including gold, different equity classes), Bitcoin's market cap has grown to rival that of major global corporations and even some traditional asset classes. Its ascent up the ranks of the world's largest assets underscores its growing acceptance and integration into the broader financial landscape. While claiming a specific rank like "5th largest" can be debated based on what's included, there's no denying Bitcoin is now a multi-trillion dollar asset class demanding attention.
The Supply Squeeze: Coins Vanish from Exchanges
Complementing the demand surge is a notable trend on the supply side: Bitcoin reserves held on cryptocurrency exchanges are dwindling rapidly. Data reveals that the amount of BTC available for immediate sale on major trading platforms has plummeted to levels not seen since November 2018. This marks a multi-year low, indicating a strong preference among holders to move their coins into self-custody or long-term storage solutions, rather than keeping them poised for sale.
What's driving this exodus from exchanges? Analysts point to several factors, including the aforementioned ETF accumulation, where authorized participants acquire Bitcoin on the open market to meet ETF share creation demand. Furthermore, there's growing anecdotal and on-chain evidence suggesting accumulation by long-term holders ("HODLers") and potentially public companies adding Bitcoin to their balance sheets. While large-scale corporate buying sprees like MicroStrategy's haven't been widely replicated across the board, the cumulative effect of sustained institutional buying (via ETFs) and dedicated HODLers consistently pulling supply off exchanges creates a powerful dynamic.
Lower exchange reserves typically correlate with reduced selling pressure. When less Bitcoin is readily available to be sold, even moderate increases in demand can have an outsized impact on price. This scarcity factor is a core tenet of Bitcoin's value proposition, underpinned by its fixed supply cap of 21 million coins, and the current trend highlights this dynamic in action.
Relative Strength: The "Cleanest Shirt in the Dirty Laundry"
Bitcoin's recent performance also stands out when compared to traditional financial markets. Over the past 30 days (as per the provided context), Bitcoin has posted significant gains (e.g., +7.68%), while major equity indices like the S&P 500 and the tech-heavy Nasdaq have experienced notable pullbacks (e.g., -6.79% and -8.14%, respectively).
This divergence has led some commentators to describe Bitcoin as the "cleanest shirt in the dirty laundry pile." In times of macroeconomic uncertainty, geopolitical tension, or wavering confidence in traditional financial systems, Bitcoin can attract capital seeking alternatives or hedges. While its correlation with risk assets like tech stocks has often been high, periods of decoupling, like the one observed recently, suggest investors may increasingly view Bitcoin through a different lens – perhaps as a non-sovereign store of value or a bet on future technological disruption, rather than just another high-beta risk asset. This relative outperformance can attract momentum traders and further bolster positive sentiment.
Technical Hurdles: The Road to $95K
From a technical analysis perspective, Bitcoin's price action is generating significant discussion. One key metric analysts watch is the "realized price," particularly for short-term holders (investors who acquired BTC relatively recently). When the market price surpasses the average acquisition cost of these recent buyers, it can signal a shift in market psychology. Those who bought recently are now in profit, potentially reducing sell pressure and encouraging further buying. Bitcoin recently surpassed this level, leading to speculation about whether this marks the beginning of a sustained rally or potentially sets up a "double top" scenario – a bearish pattern where an asset fails twice to break above a certain resistance level.
Analysts are closely watching specific price levels. There appears to be a consensus around a key resistance zone that, if decisively reclaimed and held, could signal that "all bets are off" for the bears, potentially opening the door for a significant upward move. Conversely, failure to break through these levels, or a strong rejection from them, could lead to a pullback, validating the warnings from more cautious analysts.
The $95,000 mark looms large as the next major psychological and potential technical resistance area should the current momentum continue and key lower resistance levels be overcome. Reaching this target would likely require a confluence of the factors already discussed: continued strong ETF inflows, further depletion of exchange supply, supportive macroeconomic conditions (or continued relative strength despite macro headwinds), and a decisive break through established technical resistance zones.
What Triggers the Breakout?
Achieving a breakout towards $95,000 isn't guaranteed and likely requires several catalysts:
1. Sustained ETF Demand: Continued, consistent net inflows into spot Bitcoin ETFs are paramount to absorb supply and signal ongoing institutional conviction.
2. Supply Shock Intensification: If exchange reserves continue to fall sharply, the scarcity narrative strengthens, potentially triggering FOMO (Fear Of Missing Out) buying.
3. Macroeconomic Shifts: A dovish pivot from central banks, renewed inflation fears driving demand for hard assets, or further instability in traditional markets could push more capital towards Bitcoin.
4. Technical Confirmation: A convincing break and hold above currently watched resistance levels would give technical traders confidence and potentially trigger algorithmic buying.
5. Positive Regulatory Developments: While the ETFs were a major step, further regulatory clarity or positive developments globally could reduce perceived risk.
Conclusion: Optimism Tempered with Caution
The current Bitcoin landscape presents a compelling bullish case. Resurgent ETF demand, dwindling exchange supply creating a scarcity effect, and strong relative performance against traditional assets paint an optimistic picture. Technical indicators, such as surpassing the realized price of recent buyers, add fuel to the fire, bringing targets like $95,000 into the conversation.
However, caution remains warranted. Bitcoin is notoriously volatile, and technical resistance levels often prove formidable. The risk of a "double top" or rejection at key levels is real, and regulatory headwinds or negative macroeconomic shifts could quickly alter sentiment. While the confluence of positive factors is undeniable and the path towards $95,000 seems plausible given the current dynamics, investors will be keenly watching whether ETF flows remain strong, supply continues to tighten, and crucial technical levels can be decisively overcome. The interplay between institutional adoption, HODLer conviction, and market technicals will ultimately determine if Bitcoin can conquer its next major milestone.

Do you want BTC to drop on April 27 or May 11?Do you want BTC to drop on April 27 or May 11?
If it drops on April 27, BTC will decline sharply. If it drops on May 11, BTC will only correct on the D1 timeframe and then continue rising on the weekly timeframe.
Which option do you choose?

BTCUSD 1H Forecast Hello guys, I hope years are well let me tell you that right now the order is stuck at the Bearish OB, so we will sell from here and this will remain our target until the Bullish OB and after that, our next target will remain ours until the resistance area.

BITCOIN BEST PLACE TO SELL FROM|SHORT
BITCOIN SIGNAL
Trade Direction: short
Entry Level: 92,665.30
Target Level: 86,001.16
Stop Loss: 97,096.62
RISK PROFILE
Risk level: medium
Suggested risk: 1%
Timeframe: 9h
Disclosure: I am part of Trade Nation's Influencer program and receive a monthly fee for using their TradingView charts in my analysis.
✅LIKE AND COMMENT MY IDEAS✅

BTCUSD Eyes Liquidity Sweep as Bulls Push Into Supply ZonesBTCUSD DAILY TECHNICAL ANALYSIS 📊
OVERALL TREND
📈 UPTREND — Momentum has surged, with multiple bullish candles breaking out above prior consolidation. Structure suggests a bullish continuation unless rejected at key resistance.
📉RESISTANCE ZONES
🔴 109,618.40 — PIVOT HIGH | Resistance Level
🔴 107,877.89 — SELL ORDER II
🔴 104,355.29 — SELL ORDER I
📈SUPPORT ZONES
🟢 102,576.04 — EXIT BUY | TP 4
🟢 96,169.15 — BUY ORDER | TP 3
🟢 92,012.50 — BUY ORDER | TP 2 | Mid-Pivot
🟢 86,027.66 — BUY ORDER | TP 1
🟢 79,908.44 — BUY ORDER II
🟢 76,167.19 — BUY ORDER I
🟢 74,406.60 — PIVOT LOW| Support Level
📊OSCILLATOR SIGNALS
RSI: 67.98 — Neutral, approaching overbought
MACD: 1,629.47 — 📈 Bullish crossover
Momentum: 10,006.19 — 📈 Strong upward push
Stoch RSI: 100.00 — 🔄 Extremely overbought, caution warranted
Williams %R: −5.30 — 🔻 Sell signal (overbought territory)
📈MOVING AVERAGES ALIGNMENT
All major EMAs & SMAs (10 through 200) are flashing BUY
HMA (9): 92,191.54 — supports current bullish thrust
Ichimoku Base: 84,535.45 — below price, further confirms bullish bias
🤓STRUCTURAL NOTES
BTCUSD has cleared a long-term pivot range with conviction — first time in over 2 months Price now testing supply zone between 102K and 104K
Break above 104K could trigger acceleration toward 107.8K and possibly 109.6K
Pullback scenarios would likely retest 96.1K or 92K (TP zones 2 & 3)
TRADE OUTLOOK 🔍
📈 Long bias remains strong above 92,012 with targets toward 107.8K and 109.6K
📉 Short-term profit-taking or rejections possible in 102.5K–104.3K zone
👀 Watch for confirmation of breakout or rejection from dynamic resistance at 109.6K
🧪STRATEGY RECOMMENDATION
CONSERVATIVE BULLISH PLAY:
— Entry: 92,012.50
— TP Targets: 96,169 / 102,576 / 104,355
— SL: Below 86,027
AGGRESSIVE SWING SCALP:
— Sell Orders @ 104,355 or 107,877
— TP: 96,169 / 92,012
— SL: Above 109,618
“Discipline | Consistency | PAY-tience™”

BTC or Gold?Answer Gold!
The BTC/Gold ratio is on the verge of cracking here.
A crack here will trigger a sell-off in BTC relative to Gold.
This is a very simple, low risk, ratio trade.

BTC BUYBTC BUY. BTC Breakout. We have a lagging line close above the ichimoku pro on the daily as well as a candle close. Strong breakout possible. We're still waiting for a plot line close for entry.

#BTC Update (1H Chart)Trade Bias Verification: Long (with caution for short-term bearish momentum)
Confidence Score: 6.5 out of 10 (slightly reduced due to bearish MACD crossover and RSI divergence)
Hypothesis Refinement:
The bullish continuation hypothesis still holds, but the MACD bearish crossover and RSI divergence on the 1-hour chart signal a stronger short-term pullback or consolidation phase. The price is likely to test the demand zone near 92,000 - 92,934 before resuming the uptrend. Traders should wait for signs of momentum recovery (MACD crossover back up, RSI turning up from support) before entering.
Key Levels:
Entry: Near demand zone 92,000 - 92,934, ideally after MACD bullish crossover and RSI support confirmation.
Stop-Loss: Below demand zone and Ichimoku cloud, around 91,000.
Take-Profit: Near recent highs (94,000) and daily resistance (95,000 to 100,000).
Actionable Insight:
Avoid chasing the current pullback; wait for momentum indicators to confirm a reversal near the demand zone.
Use a momentum-based entry strategy on the 1-hour timeframe, entering once MACD crosses back above the signal line and RSI shows upward momentum.
Set alerts for price approaching the demand zone and for MACD/RSI bullish signals.
Maintain stop-loss discipline below the demand zone to protect against deeper corrections.
Monitor volume for increasing buying interest on the bounce to confirm strength.

This BTC Trade went Flying!! My Original Risk to Reward (RR) for this trade was 1;18 but the move was so crazy that I never put a Target Price (TP) on it. My Stop Loss (SL) was at BE after since I reached 1;5 RR. This trade eventually now is giving me a whopping 1;38 RR. I have booked 80% partially in phases. I will let the rest float and continue. My weekly target is around 97,000.

BTC Bitcoin COT dataCOT data shows large negative divergence with small positive
Suggesting we ended Wave A on April 9th and we're in B now
With large devastating C down coming soon

Bitcoin short from 95500$Waiting for 95.5k npoc level and i am entering short , target 91k and 86k.
Lets see what this pump brings on.
We can also see 98k npoc close , if that does more agressive on shorts.

Forget Tariffs: Why Bitcoin Cares More About ETFs Than EarningsBitcoin's Great Decoupling: Why It Ignores Tariffs and Earnings, Fueled by Fundamentals and ETF Billions
In the complex tapestry of global finance, assets typically dance to the tune of macroeconomic news, central bank policies, corporate earnings reports, and geopolitical tensions like trade tariffs. Stocks rise on strong profits, bonds react to interest rate shifts, and currencies fluctuate with trade balances. Bitcoin, however, increasingly appears to be charting its own course, seemingly indifferent to the traditional market drivers that dictate the movements of legacy assets. This phenomenon, often termed "decoupling," isn't just a statistical anomaly; it's rooted in Bitcoin's fundamental nature and is gaining significant validation through the burgeoning success of US-listed Bitcoin Exchange Traded Funds (ETFs).
The core argument, as highlighted in recent market commentary, is compelling: Bitcoin's value proposition isn't tied to quarterly earnings calls, CEO performance, or the potential impact of import tariffs. It has no central bank adjusting its supply or setting its interest rate. Instead, its perceived value stems from a unique set of characteristics: verifiable digital scarcity capped at 21 million coins, a decentralized network resistant to single points of failure or control, and an emerging role as a neutral, global reserve asset in an increasingly politicized and fragmented world.
Fundamentals Over Fleeting News Cycles
Traditional assets are intrinsically linked to the health of economies and corporations. A weak earnings report can send a stock tumbling, while fears of a trade war can ripple through entire sectors. Bitcoin exists outside this framework. Its "earnings" are the security and finality provided by its blockchain; its "management" is the distributed network of miners and nodes enforcing consensus rules; its "monetary policy" is embedded in its immutable code.
This inherent separation means that while traditional markets might gyrate based on the latest Federal Reserve announcement or geopolitical flare-up, Bitcoin's trajectory is often more influenced by factors specific to its own ecosystem: adoption rates, network upgrades, regulatory clarity (or lack thereof), halving events that reduce new supply issuance, and, crucially, capital flows into vehicles that provide access to it.
The narrative suggests Bitcoin is maturing into something akin to a digital version of gold – an asset valued for its scarcity and neutrality, acting as a potential hedge against inflation, currency debasement, and systemic risks within the traditional financial system. In a world grappling with high debt levels, persistent inflation, and geopolitical instability (like the mentioned US trade war volatility), the appeal of a non-sovereign, mathematically scarce asset grows.
ETF Inflows: A Roaring Stamp of Approval
The most potent evidence supporting this decoupling narrative and Bitcoin's growing acceptance comes from the recent performance of US spot Bitcoin ETFs. Launched earlier in the year, these products represented a watershed moment, providing regulated, accessible exposure for institutional and retail investors alike through traditional brokerage accounts.
Recent data underscores their impact. On April 21st, these ETFs collectively witnessed their largest single-day net inflows since the initial launch frenzy in January, pulling in a remarkable $381.3 million. This surge in demand, with notable contributions like the $116.1 million flowing into the RK 21Shares Bitcoin ETF (ARKB), coincided directly with significant positive price action. Bitcoin decisively broke through previous resistance levels, reclaiming the $91,000 mark after a seven-week consolidation period.
These inflows are more than just numbers; they represent a tangible shift in capital allocation. They signal growing institutional comfort and strategic positioning in Bitcoin. Unlike speculative futures-driven rallies, inflows into spot ETFs reflect direct demand for the underlying asset, potentially building a more stable foundation for price appreciation. This influx suggests investors aren't just chasing momentum but are making longer-term allocations, viewing Bitcoin as a legitimate component of a diversified portfolio, independent of its correlation (or lack thereof) to other asset classes.
Price Action, Leverage, and the Path Ahead
The technical picture for Bitcoin has brightened considerably alongside these fundamental drivers. The recent surge saw Bitcoin break key bearish structures, establishing a higher low that many traders see as a potential launchpad for challenging previous all-time highs. The reclaiming of the $91,000 level was a significant psychological victory for bulls, reinforcing the positive sentiment fueled by the ETF flows. Market participants are now eyeing levels like the yearly open around $93,000 as the next major hurdle.
However, caution remains warranted. Analysts note that recent price surges have often been accompanied by significant leverage in the derivatives market. While leverage can amplify gains and accelerate upward moves, it also increases volatility and the risk of sharp liquidations if the market turns. The critical question is whether the consistent spot buying, particularly through ETFs, can absorb selling pressure and provide the underlying support needed to sustain these higher price levels. A rally built predominantly on leverage without corresponding spot demand is often viewed as less stable.
The comparison to gold's comeback potential amidst trade tensions is intriguing, but Bitcoin still needs to prove its resilience. While it has demonstrated periods of acting as a safe-haven asset, its correlation to risk assets like tech stocks can reappear, especially during broad market liquidity crises. The "decoupling" is not absolute, but rather a dominant trend driven by its unique value proposition gaining traction.
Conclusion: A Maturing Asset Forging Its Own Path
Bitcoin's recent performance, marked by significant ETF inflows and a price surge seemingly disconnected from traditional market anxieties like tariffs and earnings reports, lends strong support to the decoupling narrative. Its fundamental characteristics – scarcity, decentralization, and neutrality – are increasingly resonating in a complex global environment. The success of spot Bitcoin ETFs provides a regulated gateway for broader adoption and serves as tangible proof of growing institutional and retail demand, validating Bitcoin's role as an emerging reserve asset.
While challenges remain, including inherent volatility, regulatory uncertainties, and the need for spot demand to underpin leverage-driven moves, the trend is undeniable. Bitcoin is increasingly trading based on its own unique supply/demand dynamics and its perceived role in the future financial landscape, rather than simply mirroring the movements of traditional markets. It doesn't care about Q3 earnings or new import duties because its value proposition exists on a different plane. As capital continues to flow in via accessible vehicles like ETFs, recognizing its distinct properties, Bitcoin's journey towards becoming a truly independent, globally significant asset class continues, one block at a time.

BTCUSD- Trend line break Out(Target $100000)BTC/USD currently trades above both short-term (34-EMA and 55-EMA) and below long-term (200-EMA) moving averages on the daily chart. Minor support is around $75800; breaking below this would drag the pair down to $72000/$65000. Immediate resistance is around $88000 any breach above confirms intraday bullishness, a jump to $90000/ $95000/$100000. A secondary barrier at $110,000 indicates that closing above this level could lead to targets at $111,292, $115,000, or even $135,000.
Investment Strategy: Opportunities for Traders
Indicators (4-hour chart).
CCI(500- Bullish
Directional movement index - Bullish
It is good to buy on dips around $85000, with a stop-loss set at $78000 for a TP of $10000/$110000.

BTC -- BearishBTC bearish believe it should drift down to around 67k ish according to price action, and pattern

Bitcoin is going higherThrough my analysis I have seen that Bitcoin is gonna move a little higher until Monday on New York station we know that the market will make a new high from the last week though

Bitcoin needs a upward correction.Market needs to full fill the upper side liquidity. BTC funding rate is also increasing. so there is a good possibility market will cover up the up side liquidity.
