How One Candle Can Flip Market Sentiment | Watch These Key ZonesMarkets are emotional. One candle — that's all it takes to turn fear into greed, or hope into panic.
Over the past few weeks, traders have been caught in headlines — tariffs, global uncertainty, and endless speculation. But if you zoom out and look at the chart objectively, the structure is telling its own story.
🧠 Key Insight:
In every cycle, when fear dominates the market, it often marks the bottom.
When euphoria takes over, it’s usually the top.
This pattern repeats. The players change — the psychology doesn’t.
📌 Here’s what I’m watching on this chart:
Support zone:
Resistance to break:
Market sentiment: Currently bearish, but structure suggests potential reversal if .
📊 Always remember:
The market rewards those who focus on price action and structure, not the noise.
Let’s see how this plays out. I’ll keep updating this idea as the move develops.
Drop your thoughts below & let’s keep the analysis sharp and clear ⚔️
BEARUSD trade ideas

April 17 Bitcoin Bybit chart analysisHello
It's a Bitcoinguide.
If you have a "follower"
You can receive comment notifications on real-time travel routes and major sections.
If my analysis is helpful,
Please would like one booster button at the bottom.
This is the Bitcoin 30-minute chart.
Nasdaq indicators will be announced at 9:30 in a little while.
The purple finger section on the left
is connected to the short->long switching section that was performed on the 16th.
* When the blue finger moves,
Bidirectional neutral
Short->long switching strategy or long waiting if it goes down right away.
1. 85,728.6 dollars short position switching / cut-off price when orange resistance line is broken
2. 84,595.8 dollars long position switching / cut-off price when green support line is broken
3. 86,871.5 dollars long position 1st target -> Good 2nd target
Today's 12-hour chart MACD dead cross is an ignoring strategy. Check if the purple support line deviates from the current position,
and from the 1st section of the green support line deviates,
even those who have been holding long positions since yesterday can operate at the same stop loss price.
If the short position entry section at the top comes down without touching,
the 2nd section at the bottom is the final long waiting section (6+12 pattern),
and if the rebound is not good in this section and it is pushed,
it may continue to fall to the 3rd section at the bottom due to the pressure of the 12-hour chart MACD dead cross.
Up to this point, please use my analysis article only for reference and use,
and I hope you operate safely with the principle trading and stop loss price.
Thank you.

BTCUSD What Next? BUY!
My dear subscribers,
BTCUSD looks like it will make a good move, and here are the details:
The market is trading on 84459 pivot level.
Bias - Bullish
Technical Indicators: Both Super Trend & Pivot HL indicate a highly probable Bullish continuation.
Target - 84791
About Used Indicators:
The average true range (ATR) plays an important role in 'Supertrend' as the indicator uses ATR to calculate its value. The ATR indicator signals the degree of price volatility.
Disclosure: I am part of Trade Nation's Influencer program and receive a monthly fee for using their TradingView charts in my analysis.
———————————
WISH YOU ALL LUCK

Trendline BreakThe price has broken a daily trendline followed by a pullback on the 4 hour and 1 hour, now the price is ready for a bullish impulse
WE ONLY TRADE PULLBACKS

BTC SHORT TP:82,300 17-04-2025🚨 Time to go Short! The targets are set between 82,000 and 82,500, with the 4-hour and 8-hour timeframes indicating a bearish trend.
We anticipate this downward movement to unfold within the next 2 days. It’s crucial to enter at the right moment and consider averaging down to maximize your potential gains.
Keep an eye on market updates to adjust your strategy accordingly. Following me will ensure you stay informed about any changes and the latest insights. Let’s navigate this market together and aim for those profits! 📉💰


Bitcoin Getting Ready To Bounce AgainLooking good....looking good. Bitcoin is setting up one last time to test and try to break res line of $87600 . Within the next 12 1hr candles (if not sooner) it should start moving UP. It would be nice to see it drop fast to get rid off all those Long stop loss in the GETTEX:82K area then bounce quickly to pick the power needed to go and break the $87600 res line. After that move is printed and tested the $87600 res line it will pullback and if it doesn't print a new lower low then the new Daily and Weekly uptrend direction will be confirmed. Buckle up ladies and gentlemen we are heading for another wild ride.

bitcoin for a buy 4hr time frame is uptrend after break of structure. We trigger our entry from lower time frame which is 15 minutes.
Conclusion:Bitcoin for a buy.

BTCUSD - Buy Trade CallOn daily TF, since 20 Jan 2025 BTC was in downtrend following regression channel.
MACD also was mostly indicating short trade. However, now MACD is showing likely upward movement. Moreover, Williams Alligator also suggesting a likely change of trend to bullish.
Coupling that with USA falling stocks, BTC is a gaining attraction of US investors.
Therefore, one may take a BUY trade now or technically very correct entry would be after price crosses the resistance level ($ 88,950) which is also previous Lower High.

BTCUSD latest analysis strategyBitcoin is still struggling to break through the designated resistance level.
As long as this resistance level remains intact, it is best to wait and see before entering the market. However, as long as Bitcoin does not fall below the designated support level, we remain optimistic about its upside potential.
I am still bullish on Bitcoin, but we will wait for it to break through the resistance level before entering the market. Once it breaks through the resistance level, we will look for opportunities to enter the long position.

The Road to $100k BitcoinBitcoin is most likely forming a left-translated 60-day cycle .
Expect Bitcoin to trend downward for the next month, making a lower low in this 60-day cycle and fully scaring the market.
People will start screaming “bear market” and panic-sell their coins to market makers, institutions, and patient investors.
Once that’s done, Bitcoin will resume its bull market, heading toward a market top in Q2/Q3 2025.
This would mirror 2021’s bull market behavior, align with the 4-year Bitcoin cycle, and leave enough time for the market to fully reset by late 2026.

BITCOIN BEARS WILL DOMINATE THE MARKET|SHORT
BITCOIN SIGNAL
Trade Direction: short
Entry Level: 85,125.88
Target Level: 75,647.52
Stop Loss: 91,444.78
RISK PROFILE
Risk level: medium
Suggested risk: 1%
Timeframe: 1D
Disclosure: I am part of Trade Nation's Influencer program and receive a monthly fee for using their TradingView charts in my analysis.
✅LIKE AND COMMENT MY IDEAS✅

TheKing Cycles- Nothing can be perfect in Life or in Trading, but you can always brighten up your day.
- Remember "Cycles are Cycles"
- Everything is in graph
- You can follow bears, predicting 10 years of recession, but we are in a big recession and for a long time already.
- You can fall in the deep and predict the darkness.
- i like to see the sunshine in the morning and i will always radiate warmth.
- Follow Hope, and always believe in your own judgement.
- Be Bold and do the opposite of what commons peoples think.
Happy Tr4Ding !

The Black Swan Method- Making TA as a trader is like reading a magical ball but some major unpredictable events are out of control.
- i usually accurate most of the time but i should be a fool to think i am always right, it's impossible to make TA in that markets conditions.
- So this post is not to make some kind of predictions but to warn peoples on what's going on right now.
- i will try to explain very basically the situation (with my bad english skills, so forgive me if i make some mistakes) :
1/ the first attack was based on Luna and UST, some entities started to short UST/Luna with some billions $, FTX and SBF surely did it. Luna tried to save the situation with their BTC reserve but it was effortless. they lost all. (Luna have never been hacked, important to specify this )
2/ the fail of UST was the first step to create a snowball effect.
3/ 3AC, Celsius, Voyager, and much more were all involved in Luna/UST and Anchor Protocol witch was giving 18% returns on UST. They used customers funds in UST and staked, when the situation started to turn really bad for Luna, they tried to save the situation trading customers funds and they failed. (any of those companies have been hacked, important to specify this )
4/ FTX used customers funds and started to short their own products, FTT, SOL, SRM, etc , Binance saw the move and twitted that they will drop all their FTT.
FTX locked their customers wallets. FTX used 8B$ Customers funds to short markets. they are still right now trying to short USDT on Binance. (FTX have never been hacked, important to specify this).
5/ The snow ball started to be transformed in an avalanche. The damage here is huge. An exchange implosion of this magnitude is a gift to bitcoin haters all over the world.
6/ Sam bankman-fried was a Trojan horse in the crypto space, surely backed by banks and govs, a kind of worm witch have to be eradicated.
7/ Soon bankers will tell you, " u saw what happened with your exchanges ??!!, better use CDBC and stick with Banks!! ", this is their ultimate goal.
- i pray for everyone who got caught up in this mess and lost money with those bad actors.
- i hope you take care of yourself and continue to be a part of this journey.
- i hope it doesn't turn you off of crypto witch are here to stay in the future.
- BTC is resilient. No matter the magnitude of the earthquake.
- Buy BTC
- Store in Ledger, Trezor or Paper Wallet.
- Hodl and come back later.
Have faith in what you believe and fight. Thanks for reading!
PS : Not sure this post will get me banned or censored, but at this point the freedom of speech is an human right.

Breakdown for week 16Hello traders,
Stunning pairs on watch for next week. Lot's of potential insurance entries to mitigate the risk.
FX:AUDCAD (LONG)
FX:EURNZD (SHORT)
FX:EURJPY (LONG)
FX:GBPAUD (SHORT)
FX:GBPNZD (SHORT
CRYPTO:BTCUSD (SHORT into LONG)

BITCOIN Will Go Higher From Support! Buy!
Please, check our technical outlook for BITCOIN.
Time Frame: 9h
Current Trend: Bullish
Sentiment: Oversold (based on 7-period RSI)
Forecast: Bullish
The market is approaching a key horizontal level 84,703.50.
Considering the today's price action, probabilities will be high to see a movement to 88,907.42.
P.S
Please, note that an oversold/overbought condition can last for a long time, and therefore being oversold/overbought doesn't mean a price rally will come soon, or at all.
Disclosure: I am part of Trade Nation's Influencer program and receive a monthly fee for using their TradingView charts in my analysis.
Like and subscribe and comment my ideas if you enjoy them!

Symmetrical Triangle Nearing Resolution: Breakout or Breakdown?BTC/USD H4 Analysis – Symmetrical Triangle Nearing Resolution: Breakout or Breakdown?
📊 Technical Outlook – 4H Timeframe
Bitcoin is currently consolidating within a clear symmetrical triangle, with price tightening ahead of a potential major breakout. The chart shows price testing the upper boundary of the triangle, supported by MA13 and MA34 from below.
Key resistance zones: 86,594 and the extended target zone at 88,753. A successful breakout above this region could trigger a strong rally toward 90,000+.
Key support levels: 81,397 – 78,725 – 75,102, acting as critical retracement zones in case of downside rejection.
The structure suggests two primary scenarios:
Bullish breakout to 86,594 → 88,753, followed by a pullback and continuation higher.
False breakout or breakdown, leading to a sell-off toward 78,725 and possibly down to 75,102 if market sentiment deteriorates.
🌍 Macro Context & Market Sentiment
Investor sentiment remains fragile, impacted by ongoing geopolitical risks and the Fed’s cautious stance on monetary policy.
Altcoins are underperforming, signaling that capital rotation remains limited – often a precursor to short-term correction or distribution in BTC.
Volume is fading as price coils inside the triangle, typically a precursor to a sharp move in either direction.
🧠 Trading Strategy Ideas
Watch closely for price action near 86,594 – 88,753. If rejection or wick rejections occur, short-term pullback trades may be viable.
A breakdown below the triangle support (~84,000 area) could open up downside targets at 81,397 and 78,725.
A clean breakout with volume confirmation? Look for retest buys around 86k with continuation potential.
⚠️ Caution Advised
BTC is in a “calm-before-the-storm” zone. This is not the time to chase moves or overleverage. Let the market confirm direction and trade based on structure, not emotion.
💬 Are you leaning bullish or bearish on BTC’s next move? Will we see 90k or a drop back to 75k? Share your thoughts below! 👇👇👇

BTCUSD: a pattern like 2017BTCUSD, as of 2025, resembles the price movements in 2017. In 2017, after Trump was sworn in in January, there was a 38% drop until July. The narrative around this decline is again tariffs. The FED was again coy about cutting interest rates, etc. But as it is now, first the global M2 liquidity increase, then the FED and other central banks started quantitative easing and the minting, and then the customs agreements, and the market boomed. Then there was a 172% increase until September. After a quick correction of 40% in the same month, the top of the cycle was reached, this time with a massive 562% rise.
I predict that we are likely to see similar stories, only the price increases will not be as high as they were 8 years ago. The correction after the swearing-in ceremony was around 32% this year. In terms of technical targets, I expect a summer peak around 146k, followed by another 30-40% correction and then a blow-off top between 206-266k with a final madness and an entry into the bear market. Of course, this is purely a guess, an “educated guess” based on past macro and technical movements and the current situation. The condition that would invalidate all this and make us say “we are entering the bear market early” would be a weekly-monthly close below the 2024 peak at 73.8k. Wick down from there would not break the bull structure, as long as there is no weekly/monthly close. For me, the confirmation on the indicator side is that the Alpha Trend on the weekly chart is not selling. AT has been in a “BUY” position since January 2023.

Bitcoin Triangle Breakout Looms AheadHello traders,
4-hour BTC/USD (Bitcoin/US Dollar) chart.
🧠 Key Chart Elements
1. Chart Pattern
A symmetrical triangle (white lines) "DIAMOND" - has formed near the top of the move following a double bottom breakout.
The triangle indicates consolidation after a bullish move — often seen as a CONTINUATION pattern, but it can also break either way.
2. Double Bottom
Clearly marked, confirming a reversal from bearish to BULLISH trend.
The neckline breakout led to a strong push upwards, followed by this triangle pattern.
3. Targets
Long Target: Above 91,000 to 93,000 zone — likely measured from the triangle breakout.
Short Target: Around the 75,000-76,000 support zone — below key ascending trendline.
4. 50 EMA (Green Line)
The price is above the 50 EMA, suggesting bullish momentum is intact unless the 50 EMA breaks down.
5. MACD Indicator
The MACD lines are slightly bearish right now — potentially signaling a temporary pause or dip, but not a strong downward trend yet.
📊 Prediction: Two Likely Scenarios
✅ Bullish Scenario (Most Probable – 60%)
Why: Price is above EMA, double bottom breakout, triangle after impulse move, volume likely compressing.
Confirmation Needed: A breakout above the triangle resistance (around $85,000–$85,500).
Target: Move toward the long target zone at 91,000–93,000.
Support: Horizontal green zone and EMA provide a cushion.
❌ Bearish Scenario (Less Likely – 40%)
Why: Weak MACD signal + triangle patterns can break either way.
Bearish Trigger: A strong breakdown below triangle support and EMA, especially a candle close below ~$83,000.
Target: Drop to the short target zone at $75,000–$76,000, possibly testing the trendline.
🔔 What to Watch For
A volume spike to confirm breakout direction.
MACD bullish crossover or continued divergence.
Candle close outside the triangle — do not preempt without confirmation.
📌 Summary:
The chart shows a strong bullish setup forming after a double bottom with consolidation in a symmetrical triangle. Most likely scenario is a bullish breakout targeting the 91K+ region, unless price breaks below ~ FWB:83K , which would invalidate the bullish thesis and open room for a deeper pullback to $75K.
More power to all your trades!
Intrepid Trader

2018 Cycle Repeat? Bullish Bitcoin Until End of YearSee my DXY analysis for my full view on the performance on bitcoin (and other risk assets as well)
-Summary- bullish like 2018 until end of year.
-This chart pointing out time frames of past cycles, the over all market structure of bitcoins price, and the transformation of a bullish trend into the parabolic. (where I think we are now)

BITCOIN NEXT MOVES!Bitcoin’s Next Move
In the long run, it's clear—Bitcoin is the new digital gold. Any dip at this stage is a potential opportunity. With over 7 years of experience in Bitcoin analysis, I believe in the bigger picture and long-term value.
If you'd like me to analyze or give insights on any other coin, feel free to ask. And don’t forget to follow for more crypto updates and analysis!

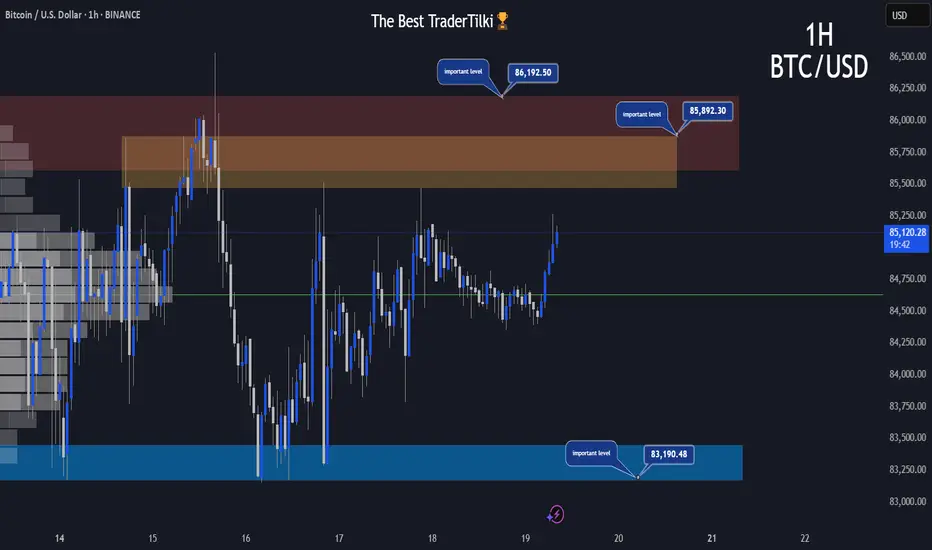
BTCUSD | 1H | IMPORTANT LEVELSHey There;
I’ve prepared a fresh Bitcoin analysis just for you.📈
Key resistance levels for Bitcoin are 85,892.00 and 86,192.00, while the support level stands at 83,190.00.⚠️
If Bitcoin breaks above the 86,192.00 level, the next target could be around 88,860.00.📣
I truly care about you all, and keeping you informed is something I see as my responsibility.🥰
Wishing you an amazing day ahead!💙
BTCDISCLAMER !!!
BTC is breakout trendline bearish short-term
Target 1 is in the green box, for the long term you can hold on
