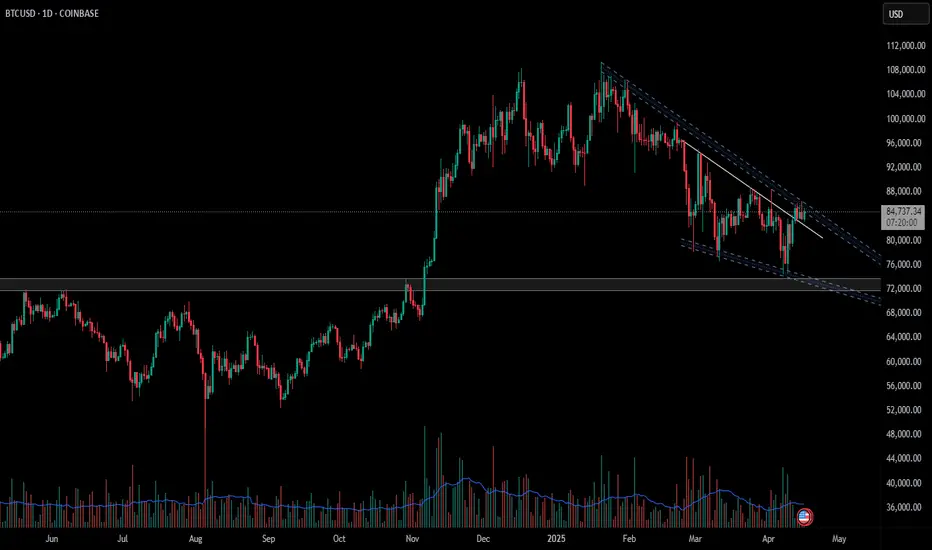
Resistance in the downward channel of BitcoinIn today’s analysis, we examine Bitcoin’s price action as it continues to respect a descending channel pattern. With current price consolidating at the upper boundary of this channel, traders are now questioning whether BTC will break out or reject and rotate lower.
Key Points Covered in This Article:
- Bitcoin is currently consolidating at resistance of the descending channel
- A break of the recent swing low could lead to a drop to $67,400 support
- Confirmation of bullish breakout requires volume-backed move above channel resistance
Bitcoin is currently pressing into the top boundary of a descending channel, where resistance is holding firm. On the lower time frame, price action has entered a period of consolidation — a key sign of indecision. However, from a structural point of view, resistance remains resistance until broken. A failure to break through the upper boundary could accelerate downside momentum.
Should the current swing low be breached, traders can expect a move toward the lower boundary of this descending channel, situated around $67,400. This level will act as the next significant support, and it may provide a potential entry for reversal plays, depending on how price behaves upon reaching it.
For bullish continuation to occur, Bitcoin must decisively break above the descending channel with strong volume confirmation. Without this signal, any moves to the upside may be short-lived and potentially lead to liquidity grabs before another rotation lower. Traders should stay patient and wait for either a clear breakout or confirmation of further downside before entering positions.
BEARUSD trade ideas

BTC/USD Technical Outlook📊 BTC/USD Technical Outlook
Rounded Top Formation signals exhaustion of bullish momentum.
Price respecting a descending channel, showing structured bearish correction.
Supply Zone: $96K–$100K – major resistance; price likely to reject here if tested.
Key Levels:
Support: $80.5K → $74.7K → $56K → $48.6K → $39.7K
Resistance: Descending trendline & supply zone
Two Scenarios:
✅ Bullish: Break above channel + $96K = retest ATH zone.
❌ Bearish: Rejection + break below $74.7K = targets $56K and lower.
Current Bias: Bearish unless breakout confirms above descending structure. 📉 Fundamental View
Bitcoin Halving supports long-term bullish case.
Fed’s policy & inflation will drive short-term volatility.
Institutional news already priced in; any surprises = big moves.

BITCOIN WEEKLY ANALYSIS - April 18th, 2025BTC/USD is currently hovering just below a major descending trendline and key horizontal resistance near the 91,500 level. 🧱
🔍 What We’re Watching:
- Price has tested the downtrend line multiple times — the structure is weakening.
- A breakout above 87,500 could trigger a strong bullish move.
- Until then, "Wait for the Breakout" remains the strategy. No confirmed long entries yet.
📉 Current Price: $84,500
📈 Breakout Confirmation: Clean close above resistance zone + volume spike = 🔥🔥 potential rally.
🧠 Pro Tip: False breakouts are common. Watch for confirmation — not just a wick!
Stay sharp, stay patient. Breakouts give the best reward-risk trades! 💹

BTC Bearish structureSee the bearish structure we are holding.
We hit 100K, broke it, and its bitcoin... deep correction is on the way, forming lower highs on the lower daily timeframe.
Be alert that the price might do a TEST, hit stoplosses of shorts, then the short will happen.

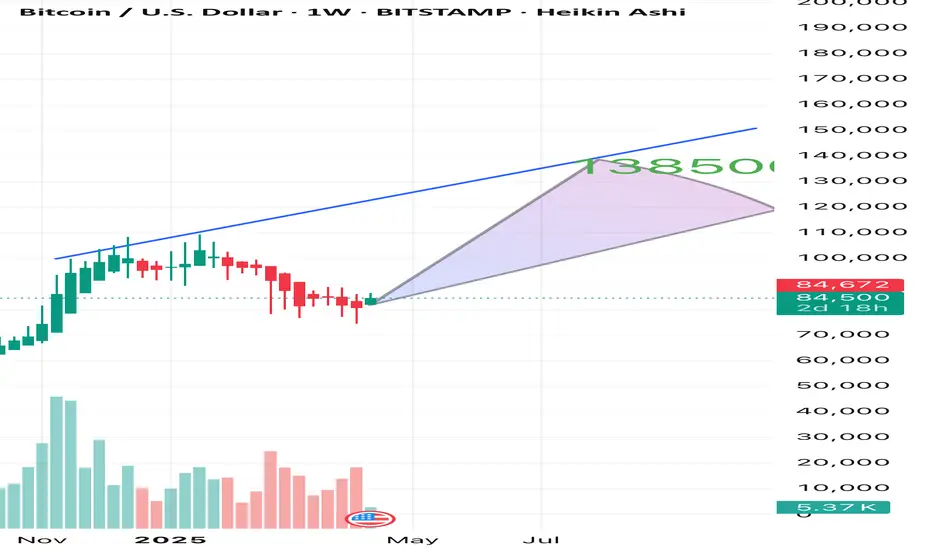
Bitcoin - 2025After a long consolidation around $100,000, and a correction of ~32% from the top, it seems we are preparing for a new move.
In the previous idea, I mentioned that there could be either consolidation or a healthy correction, but both happened.
I will describe several scenarios that I see.
I will describe only positive, super-positive and ultra-positive ones.
Since the negative sounds like this - we have already reached the peak, there will be a small over-high, and we will go bearish.
Positive scenario - parabolic growth, with a new peak in the region of $150,000-$200,000
Super-positive scenario - parabolic growth, with a new peak in the region of $200,000-$300,000
Ultra-positive scenario - parabolic growth, with a new peak in the region of $300,000-$400,000
Now you must ask - can we really reach $400,000, how is this possible, with the current price of $84,000, and April outside the window?
I will tell you that there is nothing complicated or incredible here, that is why it is ultra-positive.
But you should focus only on positive and negative scenarios, and not float in the clouds hoping for a miracle.
As for altcoins, in this scenario, I don't think Bitcoin dominance will last long, so high, in any case, soon there will either be an overflow and altcoins will start shooting, or we will all die from the paws of bears
HOLD YOUR BEARS, IT'S NOT OVER

BTC: Time to buy?After having supported the 75k support and breaking the downward resistance (yellow), I understand that it could be a good sign for a rise. Waiting for 100k again?

Bias is still the same, forecast slightly differentStill aiming bullish for BTC.
Explained within the video.

The Path is ClearThe textbook head and shoulders broke out and back tested the neck line. Almost time for number go up

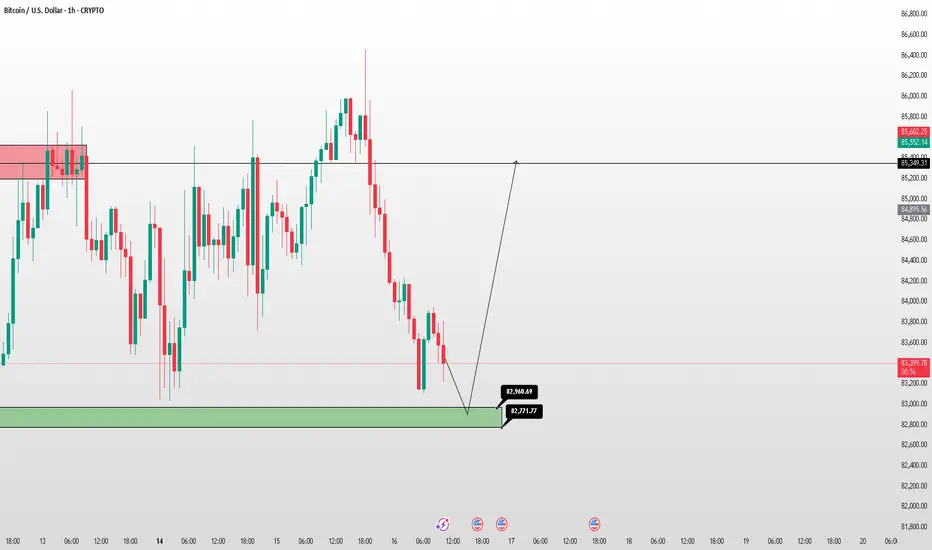
BTC/USD – Buy Setup🚀 BTC/USD – Buy Setup (April 16, 2025)
🔹 Demand Zone: 82,771 – 82,960
🔹 Take Profit: 85,349
⚡ Rules:
Buy if price reaches 82,771–82,960.
Stop Loss: Below 82,700.
Hold until 85,349 (or scale out).
#Bitcoin #Trading #Crypto #FXF #FXFOREVER
Bullish downward channel exitThe macroeconomic environment as well as bulls stepping in during downturns, makes a breakout here probable.
Clean breakout of this big descending channel, and we retest 100k

BTC in 17 April 2025Potential Major Move on Thursday, April 17, 2025 📍
📊 Based on an analysis of historical Bitcoin chart averages and similar patterns, there is a likelihood of a significant price movement on this date.
This analysis is conducted using technical analysis and a detailed examination of Bitcoin’s movement averages. It suggests that approximately every 150 days after the start of a neutral trend, we can expect a sharp upward or downward move that sets the stage for the main trend in the future.
📅 As of the current date, March 29, 2025, there are about 18 days left until this significant event.
You can follow the results of this analysis and the conducted review on TradingView on the specified date.

BTC/USDT – Trap Activated: Is the Final Flush Coming?📆 Follow-up to our April 16 idea:
Back then we warned:
“Fake pump to 85.8K, followed by a drop to 81.5K. Tape is rotten, stops are baited, and Delta screams ‘run!’”
Well... here’s what’s happened since:
✅ What’s been confirmed:
BTC pushed into the 85.5K–85.8K trap zone and got rejected hard
Delta turned positive briefly – but with no price continuation
OI stayed flat = no real conviction = stealth distribution
Tape showed clear absorption at the highs
🎯 The trap we predicted is now active. Bulls walked right into it.
❗ What’s still to come (likely very soon):
The final flush of long positions hasn't happened yet.
Updated liquidation maps (1D & 48H) show massive clusters below 82.8K–81.2K full of over-leveraged longs.
⚠️ If price breaks below 83K with volume + strong red delta...
💣 Expect a liquidation cascade.
🧠 Strategy (Still Aligned with April 16)
🔻 SHORT (Primary Idea)
Entry: Rejection at 85.5K–85.8K
SL: 86.2K
TP1: 83.2K
TP2: 81.5K
🔺 LONG (Only if the flush comes first)
Entry: Sweep down to 82.8K + delta reversal + OI spike
SL: 81.8K
TP: 84.8–85.2K
🌍 Updated Macro Context:
USD still strong 💵
Fed not pivoting anytime soon 🏦
Trump’s BTC reserve news = bullish narrative, but no short-term impact yet
📉 Macro still favors risk-off sentiment
🎭 Final Words from the Pôncio Doctrine:
“The trap is active. The stops are aligned.
Now we just wait for one institutional candle to wipe the board.”
If this breaks… you’ve officially been Pônciado.

BTC LONG TP:91,000 15-04-2025🚀 Time to go Long! Targets are set between 90,000 and 91,000, with the 4-hour and 8-hour timeframes showing a strong bullish trend.
We expect this movement to materialize within 2 to 3 days, so be sure to enter and average down as needed.
Stay tuned for updates to optimize your gains. Follow me to stay informed, and let’s work together to boost those profits! 💰🔥

Analysis of the BTC Market Situation and Trading RecommendationsIn terms of the daily K-line of BTC at present, the highest price has reached 85,800, and the lowest price is 83,600. The price is still suppressed by the strong EMA60 trend line, with the resistance level at 86,300. The support provided by the EMA30 below is also very strong, and the support level is at 83,700. The overall trend shows a contracting trend. Given that the price has remained at a similar position on the trend line for several consecutive days, this situation is not common in the market. Therefore, there is a possibility that the main funds will take this opportunity to launch an upward impact. If the price fails to successfully break through the resistance level of 86,300, there is a high probability of a reverse plunge in the market. From the perspective of technical indicators, the MACD indicator has continuously increased in volume, indicating signs of capital inflow. However, the K-line shows a divergent state due to facing strong pressure. The Bollinger Bands are in a sideways state. Currently, the K-line is at the middle band at 82,850 but has been unable to make an upward impact on the upper band's resistance level of 88,200. In this situation, whether it can effectively break through the box resistance level of 86,250 has become the key to the market trend.
On the four-hour K-line chart, the characteristics of the top structure are remarkable. The K-line continues to move sideways above the trend line. At the same time, the trend indicators show an upward alternating diffusion trend. This kind of top divergence structure has frequently appeared in past market conditions. At this time, the MACD indicator has decreased in volume and is moving downward. The DIF and DEA indicators are also diffusing downward at a high level. However, the K-line is moving upward in divergence from them. The Bollinger Bands are in a contracting state. Pay attention to the upper band's resistance level at 85,700, and the lower band's support level is at 82,700. The current contracting market is still continuing, and the top divergence situation is becoming more and more serious. Based on this market situation, before the box is broken, investors can consider conducting swing trading. Once the box is broken, determine the subsequent investment direction according to the new market pattern.
BTC Trading Suggestion:
buy@83000-83500 tp:84500-85500
sell@86500-87000 tp:85500-84500
Investment itself doesn't carry risks; it's only when investment is out of control that risks arise. When trading, always remember not to act on impulse. I will share trading signals every day. All the signals have been accurate without any mistakes for a whole month. No matter what gains or losses you've had in the past, with my help, you have the hope of achieving a breakthrough in your investment.

possible breakout for long term investment (1D TF chart)Previously, Bitcoin faced rejection and dropped sharply after touching the upper trendline. However, this time, it's showing strength by consolidating near the same level for the last 5 days. This could indicate accumulation or a potential breakout attempt.
BTCBTC oversold on daily timeframe formed regular bullish divergence.
Tariff war makes perfect panic selling.
Last 2 times it happen price went up almost 2x.
Price was grabbing liquidity under 200 day MA.
It was good place to add spot for long term hold.
Now expecting some good times ahead, if something terrible doesn’t happen.

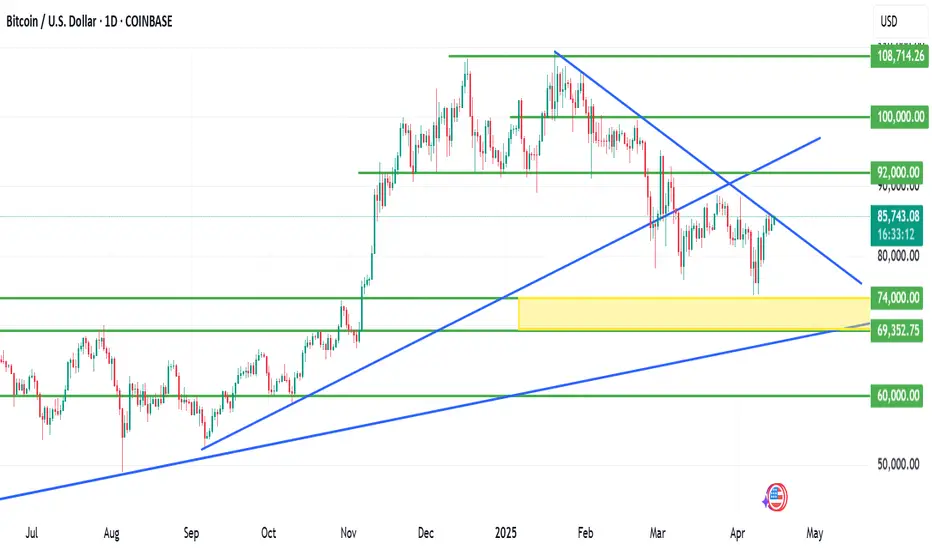
BITCOIN is kissing a critical resistance zoneBITCOIN is kissing a critical resistance zone.
Bitcoin is currently kissing a critical resistance zone, hovering around the $85,500 level. This region aligns closely with a descending trendline that has historically capped BTC rallies, and this test comes after a sharp recovery from a local low near $74,000, a drop that was triggered in tandem with broader risk-asset selloffs following U.S. tariff announcements and rising global macroeconomic tension.
Technical Analysis
The descending trendline (marked in blue on the chart) acts as a key resistance.
A daily close above $85,800 - $86,200 could confirm a breakout, potentially paving the way for a fresh attempt toward the $90,000 psychological level.
Conversely, failure to break and hold above this resistance could cause a rejection and pullback.
Immediate downside support lies at the previous local low (~$74,000), and below that, the next strong support zone is around $69,000 (yellow block on chart).
Fundamental Backdrop
Bitcoin continues to be driven by macroeconomic news, institutional flows, and growing ETF inflows.
If fundamentals remain bullish, including continued institutional accumulation, favorable regulatory developments, or increased on-chain activity, they could fuel momentum for a breakout.
The market doesn’t reward assumptions — it rewards preparation.
Whether it’s a breakout or a pullback, risk management should always come first. As always, protect your capital before thinking of profit. Use stop-losses, scale your entries, and avoid over-leveraging in volatile zones like this.
What’s your take on BTC at this juncture?
Do you see a breakout brewing, or is this another trap for over-leveraged bulls?
Let’s discuss
BITCOIN NEXT MOVES!Bitcoin’s Next Move
In the long run, it's clear—Bitcoin is the new digital gold. Any dip at this stage is a potential opportunity. With over 7 years of experience in Bitcoin analysis, I believe in the bigger picture and long-term value.
If you'd like me to analyze or give insights on any other coin, feel free to ask. And don’t forget to follow for more crypto updates and analysis!

Volume smother by worlds best trader yashThis volume smoother helps us to know about volume Trend and bullishness or bearishness in char


Long trade opportunity is coming Bitcoin price is starting to look interesting for a long trade opportunity.
Currently Bitcoin is in the range bound between 75,000 approx and 89,500 aprox (blue rectangular box in the chart).
EMA 200 is horizontally running through in the middle of the range and EMA 21, 55 and 200 are starting to get bunched up together. I really like this set up because when this happens, it is often followed by a strong directional move. All you need for now is patience, which is the hardest thing to do.
I will open a long position if the following conditions are met:
1) Daily MACD and RSI will move into the bull zone and they are clearly pointing to the upside.
2)The price will move and close above the descending trendline.
3) EMAs are going to start to spread out and line up properly (EMA 21>55>200 for long)
For whatever reasons, if I feel I need to be more cautious, I might wait for the price to move and close above 93,000 (above orange rectangular box area) because it is a high liquidity area and I think a lot of price manipulation might happen.

correctionIt is expected that a trend change will form within the resistance trend line and we will witness the start of a correction. Then, it is likely that the correction pattern will end at the specified support levels.

138500 next couple of week Bitcoin bullish now we will pump any time to soon in few months we will around 138500 area of resistance to test so this extra pumped