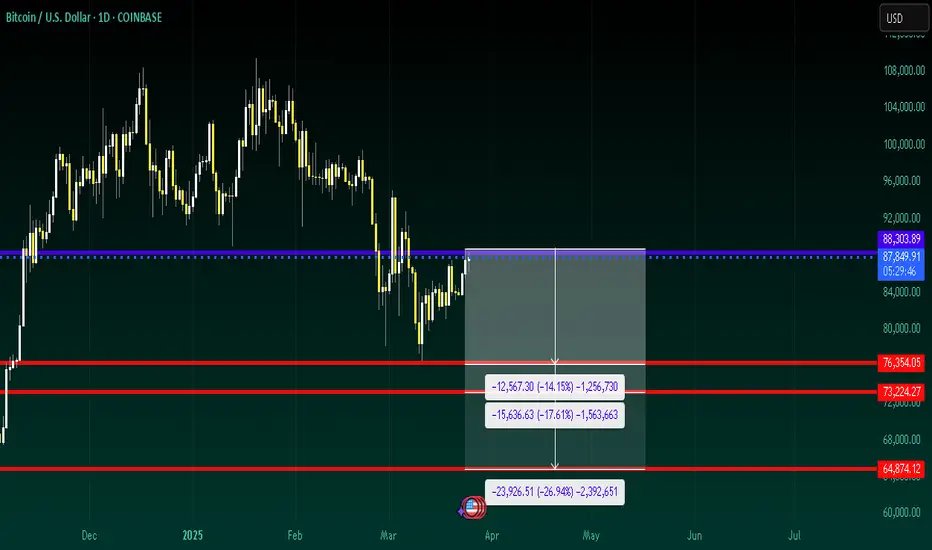
Bitcoin Short: End of Wave 2 of CI go through the Elliott Wave Counts here and why I think this is a good. I also discuss the various take profit targets.
Essentially, I believe we have ended wave 2 of C and will be going for a wave 3 of C.
BEARUSD trade ideas

BTCUSD: Attacking the 2025 Resistance looking for huge breakout!Bitcoin turned neutral on both its 1D (RSI = 47.243, MACD = -1813.400, ADX = 31.557) and 1W (RSI = 45.530) technical outlooks following the 90-day tariff pause. Technically it is going after the LH top of the Falling Wedge from its ATH and the 1D MA50, which has been the main Resistance since February 4th 2025. There is a key Bullish Divergence on the 1D RSI too, being on HL as opposed to the LL of the Falling Wedge. A breakout above the Wedge typically sets a technical target on the 2.0 Fibonacci extension, which falls just under the ATH Resistance Zone. Be ready to go long if the breakout takes place (TP = 106,000).
## If you like our free content follow our profile to get more daily ideas. ##
## Comments and likes are greatly appreciated. ##

Massive bullish divergence on BTCUSD 1D chartThe is a massive bullish divergence on the BTCUSD 1D chart.

Bitcoin at $83K – Is This the Calm Before the Next Surge or a TrBTC/USD Daily Technical Outlook – April 9, 2025
Bitcoin is currently consolidating just below the psychological $85,000 level after a historic bull run that pushed price to fresh all-time highs. The market is cooling off — not crashing — with price action forming a high-tight flag, often a continuation signal after a vertical move.
However, with momentum slowing and volatility compressing, traders must prepare for a major breakout or breakdown in the coming days.
📈 Trend Structure:
BTC/USD remains in a strong bullish trend. Since the breakout above $69,000 (previous ATH from 2021), the rally has been aggressive and directional — barely giving bears a chance to breathe.
Price has formed a series of higher highs and higher lows, respecting a steep ascending trendline since early February. But now, the pair is coiling near the highs, forming a tight range between $80,000 and $83,500.
🔹 Key Resistance Zones:
$83,500 – $85,000: Immediate resistance; this area has capped price multiple times in recent sessions. A daily close above this zone could trigger the next leg higher.
$88,000: Near-term bullish target based on measured move from recent consolidation.
$90,000 – $92,000: A psychological milestone — and a possible magnet for price if bulls break out cleanly.
🔸 Key Support Zones:
$80,000: Round number support — the floor of the current consolidation.
$76,500: Previous breakout zone and minor demand area.
$72,000 – $74,000: Major support and ideal re-test level if BTC corrects — where many sidelined bulls are likely waiting to buy in.
📐 Technical Pattern:
Bitcoin is forming a high-tight flag — a bullish continuation pattern typically found after strong vertical rallies. The range is tightening, volume is dropping, and volatility is compressing — classic signs that a volatility expansion is coming soon.
A breakout above $83,500–85,000 would confirm the flag and likely ignite a sharp move to FWB:88K or higher. On the flip side, a breakdown below $80K could send price to retest $76.5K or even $74K — which would still be healthy within the broader trend.
🧭 Scenarios to Watch:
✅ Bullish Scenario:
A breakout and daily close above $85,000 would confirm the continuation pattern, targeting $88,000 first, then $90,000+. Volume and candle structure will be key to confirming the move.
❌ Bearish Scenario:
If price fails to break out and instead drops below $80,000, a correction could unfold toward $76,500 or even $74,000 — presenting a potential re-entry opportunity for long-term bulls.
📌 Conclusion:
Bitcoin is trading near all-time highs in a classic consolidation phase. Price action favors the bulls, but the breakout hasn’t confirmed — yet. Whether BTC breaks above $85K or drops below $80K will likely define the next major swing.
As always, let the candles tell the story — and don’t chase, wait for confirmation.
💬 Are we about to see Bitcoin above $90K? Or is this distribution in disguise? Drop your thoughts 👇

BTC Last growth before a serious plunge! We're approaching the final leg up in this bull cycle. My projection puts the ultimate ATH around $120K, likely reached in the coming months. But don't get too comfortable—what follows could shake the market.
I'm expecting a 5-wave ABCDE correction that could bring BTC back down to the $58–60K zone, with the correction likely concluding around March 2026.
This could be the last major pump before a multi-year reset. Buckle up and plan your exits wisely. 📉📈
#BTC #Bitcoin #Crypto #CryptoAnalysis #BTCUSD #Altcoins #CycleTop #BearMarketPrep

bullish for bitcoinBitcoin is about to buy it's now or never up we go without looking at the back, break and retest.

Bitcoin Trade Setup: Bullish Breakout Targeting $87K!🔹 Key Levels Identified:
📌 Target Point: 87,008.21 USD 🏁🔵
👉 Expected price move (+9.07%) 🚀
📌 Entry Point: 79,719.00 USD ✅
👉 Suggested buying level in demand zone 🏦
📌 Stop Loss: 78,213.25 USD ❌🔻
👉 Risk management level 📉
📊 Technical Analysis:
📈 Trendline Support:
🔵 The price bounced off the trendline 📊, confirming an uptrend 📈
🔵 Demand Zone:
🟦 Marked blue area = Buyer interest 📊
💰 Expected reversal zone if price retests
📊 Moving Average (DEMA 9):
🔸 82,343.85 USD (current level)
🔺 Price slightly below DEMA ➝ possible bullish reversal 🚀
⚡ Trade Setup:
✔️ Risk-to-Reward Ratio:
🟢 Potential profit: +7,220.76 USD
🔴 Risk: -1,500 USD
📊 Favorable trade setup with high reward vs low risk ✅
✔️ Momentum Confirmation:
🟢 Above 79,719 USD = 🚀 Bullish breakout
🔴 Below 78,213.25 USD = ❌ Stop Loss triggered
🔮 Conclusion:
🔥 Bullish setup if price holds demand zone!
🚀 Target: 87,008 USD
⚠️ Manage risk with stop loss! 📉

BTCUSD – Bullish Breakout Loading ?
📈 *Bitcoin Daily Chart Analysis – April 14, 2025*
Bitcoin is looking 🔥 as it pushes higher from a key **accumulation zone** after a sharp recovery from recent lows. The previous **rising channel** was broken to the downside, but now the price is forming a solid **bullish structure**, suggesting a strong comeback is in play!
---
### 🔍 Technical Highlights:
- ✅ **Demand Zone Bounce:** Clean rebound from the highlighted green box (accumulation area), signaling buyer strength.
- 📈 **Higher Highs Incoming?** Price is now consolidating near **$85,000**, with bullish momentum building.
- 📊 **Upside Target:** Eyes on $87,000 → $88,500 if momentum sustains and daily closes continue above resistance.
- 📌 **Key Support:** $84,000 holds the line — invalidation below that would shift bias.
---
### 🧠 Trader's Insight:
The structure is setting up for a **potential bullish continuation**. Momentum traders should watch for a confirmed break and close above $85,400 for further upside! 🚀
💬 *"Patience in accumulation pays in breakout."*
Ready to catch the next leg up? 📲 Let’s trade smart and ride the wave.

BTC 97K Long Target Inverse Head and ShouldersTHIS BLUE NECKLINE IS 100% THE LINE TO FOLLOW
Inverse Head And Shoulders
Active Long Target - 97,050
What To Expect?
Trump's tweets are highly volatility just like the markets so rather then trying to call the exact bottom use this for your bull / bear transition. I'm not saying when it will happen... but above the blue line bullish, below it flip bearish despite it would take a number in the 60Ks to invalidate this target.
Downside seems to be the orange support line in 73.8... but money is on 97K sooner than later and this chart staying valid.

Ahmed NagarAhmad Nagar Trading is a trusted stock market investment company committed to empowering individuals and businesses with smart, strategic, and secure financial growth opportunities. Based on deep market insights, advanced analytics, and personalized investment strategies, we help our clients navigate the complexities of the stock market with confidence.
With a team of experienced traders and financial advisors, Ahmad Nagar Trading offers a wide range of services, including portfolio management, equity investments, trading consultation, risk assessment, and long-term wealth planning. Whether you're a beginner or a seasoned investor, we tailor our solutions to suit your goals and risk appetite.
At Ahmad Nagar Trading, our mission is to build financial freedom and trust—one investment at a time.

Crypto Updated Short & Long-Term AnalysisStill staying patient even though we got in (at the perfect level) on the big 3, BTC, ETH, XRP.
As I mentioned previously, those were my initial entries and I am looking for further downside before entering with my full cash-allocation.
Here is what I'm looking for in terms of short-term rejection and deeper liquidity build - which will likely align with the broader market taking another tumble.
Happy Trading :)

The latest analysis of Bitcoin is in a downward channelBTC is currently trading within a well-defined descending channel, showing consistent lower highs and lower lows since mid-March.
Descending Channel: The upper and lower boundaries have acted as reliable resistance and support zones.
Double Bottom Pattern: Price action recently formed a double bottom near the $75,000 zone (marked "HUNT2"), which is typically a bullish reversal signal.
Breakout Target: The neckline breakout from the double bottom targets the $85,000–86,000 zone, which aligns with the upper boundary of the channel — a confluence resistance.
Fakeouts (HUNT1 & HUNT2): These "hunt" zones likely represent liquidity grabs or stop-loss sweeps, indicating strong institutional manipulation before major moves.
Bullish Scenario: After touching the lower level of the neckline, it goes to touch the top line of the channel and touches the target of the pattern.
.
Bearish Scenario: Rejection from the $85K zone could send BTC back down toward
73K
–$ 74 K. Further downside could bring the $69K–$70K zone into focus.

BTCUSDWeekly accumulation and probably manipulation.
Would like to see a Daily market structure shift, with a FVG for a long trade.

Recent BTC hourly candles: Pure algo magick!Look at how these candles are playing with the lows and the body levels both algorithmically. This is HTF bot work

BITCOIN NEXT MOVES!Bitcoin’s Next Move
In the long run, it's clear—Bitcoin is the new digital gold. Any dip at this stage is a potential opportunity. With over 7 years of experience in Bitcoin analysis, I believe in the bigger picture and long-term value.
If you'd like me to analyze or give insights on any other coin, feel free to ask. And don’t forget to follow for more crypto updates and analysis!

BITCOIN SHORT FORECAST Q2 FY25im expecting price to reject my point of resistance and drive down lower to the price levels in red
it did make a nice set of higher highs but didnt break any structure on the daily you notice that the structure leading to my
resistance has gotten shorter indicating weakness (clearer on h4)
i made a post on the short as it hit 102k im just insighting
more shorts ahead when reversal idk
last post
dont miss the 500 follower giveaway
ALTS Season Starts in JuneALTS Season 2025 will be short and sweet.
Let the BTC collapse if you want the ALTS Season faster
Approximate date is June 9th

Bitcoin ready to retrace ?Hello All, As per me there are 2 retesting pending, I am expecting this retesting to be completed by Jan ... Lets hope for the best

* BTC Elliot Waves Update: We're bullish but cautious *Hello son's and daughter's of mothers and father,
I hope you enjoy this update!
Don't be afraid to criticize or correct things that I might have missed. I encourage it because it helps a lot with the learning!

Will BTC emerge from the descending channel on top?Hello everyone, I invite you to review the current situation on BTC. On the one-day interval, you can see how the price is moving in the downtrend channel in which there is again a fight with the upper boundary of the channel. At this stage, you can also see how the EMA Cross 50/200, they have come very close but still indicate the maintenance of a long-term upward trend.
Here you can see how the price has currently bounced off the resistance zone from $ 86,503 to $ 87,934. Only an upper exit from this zone will open the way towards the second important zone at the levels of $ 93,959 to $ 96,142, and then we have visible strong resistance around $ 101,800.
Looking the other way, you can see that in the event of further declines, we have support at $ 80,550, then you can see an important zone that previously maintained the price decline from $ 74,340 to $ 71,380, in a situation where this zone is broken, we can see a quick decline to around $ 65,360.
The MACD indicator shows an attempt to switch to an upward trend, it is worth watching whether there is enough energy for further movement.

BTCUSD is in downtrend currentlly consolidatingBTCUSD is in downtrend currentlly consolidating. Like all other asset classes, its price is being affected by negative market sentiments prevailing with Tariff war.

SHORT TERM Bullish set up on Btc usd Liquidity area.
.we'll experience a liquidity grab pretty soon and then,we'll take off to the up side.. take profit at 86,-000
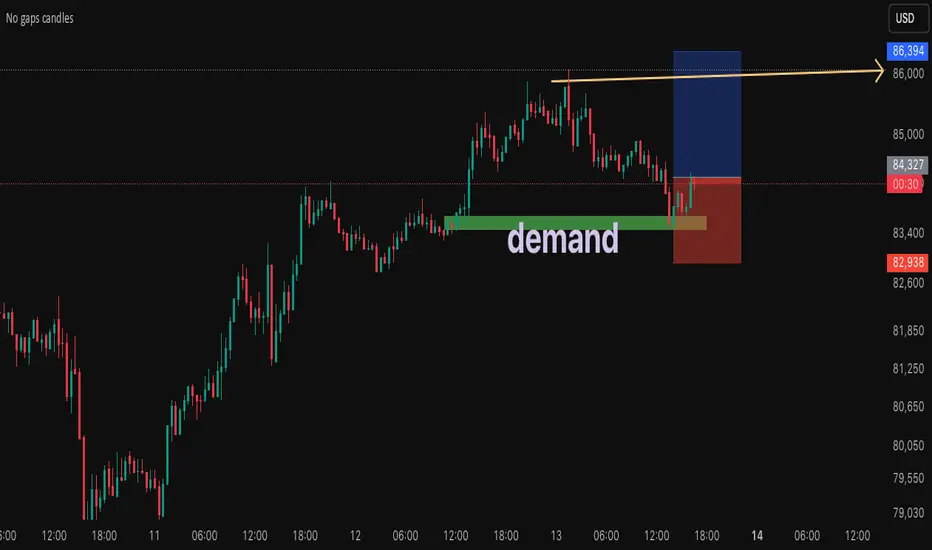
Why is BTC losing volume?!After establishing a new higher high on the rally, we have run into an old bearish zone from April 2nd and losing gas. This is about the end of this bullish cycle is seems and we are getting hourly chart candle indications of this.
As you see there is a small bit to go before we can establish ourselves back above the bearish fair value gap (balance).
Apparently this bearish FVG was still chock full of pending shorts. We are getting multiple failures to displace above highs I was triggered short.
As we close below the highest bullish candle, we should see a mass closing of longs from its low. First target is the inefficient range below (blue) around 84K
I believe we must go back to around the50% Fib retracement range as always and correct all imbalances and collect all lows within that range. Therefore I am short after the 11p candle pushed up out of the 10p candle but failed to close above.
As always I use failure displacement as a cue to look for a good LTF entry 🫡
4H Review shows massive bearish imbalance:
