Bitcoin going back to 97k ? Follow up on my last idea.
Bitcoin will probably return to the 95/97 k
Stop loss: 69.5 K
Take profit: Around 95/96k
BEARUSD trade ideas

Shorting Analysis on Bitcoin - Fxdollars- {15/04/2025}Educational Analysis says that BTCUSD may give countertrend opportunities from this range, according to my technical analysis.
Broker - BITSTAMP
So, my analysis is based on a top-down approach from weekly to trend range to internal trend range.
So my analysis comprises of two structures: 1) Break of structure on weekly range and 2) External pushback to fill the remaining fair value gap
Let's see what this pair brings to the table for us in the future.
Please check the comment section to see how this turned out.
DISCLAIMER:-
This is not an entry signal. THIS IS ONLY EDUCATIONAL PURPOSE ANALYSIS.
I have no concerns with your profit and loss from this analysis.
I HAVE NO CONCERNS WITH YOUR PROFIT OR LOSS,
Happy Trading, Fx Dollars.

BITCOIN's ultimate VIX bottom signal-Last time gave +100% profitBitcoin (BTCUSD) is attempting to make yet another green day, yesterday not only did it close above its 1D MA50 again but was also the 4th green day in the last 6. This attempt is showing that the trend is gradually shifting again towards long-term bullish but today we'll present to you another one, this time in relation to the Volatility Index (VIX).
BTC's (orange trend-line) recent rise is naturally on a negative correlation with VIX (red trend-line) which is currently pulling back after it's most aggressive spike since the COVID flash-crash (March 2020).
Their ratio BTCUSD/VIX (blue trend-line) made a very interesting contact with the Higher Lows trend-line that has been holding since the August 24 2015 Low, which was the bottom of the 2014 Bear Cycle. Since then it made Higher Lows on March 16 2020, August 05 2024 and the most recent, April 07 2025. Every time it was a bottom indication and a massive rally followed. The 'weakest' of all was the previous one, which 'only' gave a +105% rise approximately. Based on that, there is no reason not to expect BTC to hit at least $150k by the end of this Bull Cycle.
Do you think that's a plausible target? Feel free to let us know in the comments section below!
-------------------------------------------------------------------------------
** Please LIKE 👍, FOLLOW ✅, SHARE 🙌 and COMMENT ✍ if you enjoy this idea! Also share your ideas and charts in the comments section below! This is best way to keep it relevant, support us, keep the content here free and allow the idea to reach as many people as possible. **
-------------------------------------------------------------------------------
💸💸💸💸💸💸
👇 👇 👇 👇 👇 👇

BTCUSD 4H FORECAST PREDICTION Hello Guys I Hope you're all well
Hey there our Global forex community charts on btcusd on 4hTF looking for vertical zone on Monday our prediction was buy side and now seems going on top to bottom still running on our prediction as we say and we hope we can hit our target to this weekend
Hope you guys all well thanks

Bitcoin Above The 50 MABitcoin has climbed back above the 50-day moving average (blue line) – a level it hasn’t closed above since January. That alone is notable – it marks a potential shift in momentum after months of trending beneath it. That said, the 200-day moving average (red line) still looms above as overhead resistance and hasn’t been tested on this push yet.
Price action has been constructive off the lows, with higher highs and higher lows forming over the past two weeks. Volume has picked up modestly, though not convincingly, suggesting the rally is cautious rather than euphoric. The $73,835 support level continues to hold firm as the critical line in the sand below.
It’s too early to declare a trend reversal, but closing multiple daily candles above the 50 MA would be a positive signal for bulls. Keep an eye on the 200 MA just above – cracking that level would open the door to more aggressive upside.

Bitcoin breaks resistance trend lineIn another sign of recovery, Bitcoin is trying to break away from a key short-term resistance trend line that has been in place since the cryptocurrency topped out in January this year at above $109K.
BTC/USD has already reclaimed a few short-term levels such as FWB:83K and moved above the 21-day exponential moving average to provide the first objective bullish signal.
More work is still needed before we get the all-clear, with the 200-day average and more importantly a key resistance range around $90K (specifically in the $88.8K to $91.2K range) to contend with.
Still, we have a few tentative signs of a possible reversal, which is evidenced across risk assets including major stock indices.
By Fawad Razaqzada, market analyst with FOREX.com

HOW BTC GONNA BE 1M IN 2 YEARS
HI.
Gotcha..
Without filling the dots on fundamental n value etc.
I am over simplifying this idea in 2 lines.. uptrend support n resistance line on MoM
Don't get excited becoz it's only 10X on 1:1
and 2-3 years 1000 days..
Few conditions before you make a move.. ( follow and share ) :)
:- you should have a plan
:- you can start slowly (it's going to be long ride brother & sister)
:::::PM me.. I will give you my mind for free.. ( caveat emptor )
Please don't trust me.
I'm not a guru.
If it clicks.. go for it

April 14 Bitcoin Bybit chart analysisHello
It's a Bitcoinguide.
If you have a "follower"
You can receive comment notifications on real-time travel routes and major sections.
If my analysis is helpful,
Please would like one booster button at the bottom.
Here is the Bitcoin 30-minute chart.
There is no Nasdaq indicator announcement today.
I created a strategy based on the possibility of a strong decline in Tether dominance centered on the Gap section at the bottom of Nasdaq and Bitcoin.
*One-way long position strategy when the red finger moves
1. 83,690.8 dollars long position entry section / cut-off price when the green support line is broken
2. 85,772.3 dollars long position 1st target -> Top 2nd -> Good 3rd target.
If the strategy is successful, I have indicated the long position re-entry section.
Today, it is best to maintain the purple support line
because it maintains the mid-term pattern and the daily candle bottom section.
The mid-term pattern can be broken from the 1st section,
and it can be a sideways market until the 2nd section,
and it can decline step by step from the bottom -> 3rd section.
Up to this point, I ask that you simply use my analysis for reference and use only.
I hope that you operate safely with the principle of trading and cut-off price.
Thank you.

Bitcoin daily Raising wedge🧠 Chart Breakdown – BTC/USD (Daily)
📉 Pattern: Falling Wedge
BTC has been moving within a falling wedge, a bullish reversal pattern.
The wedge is now broken to the upside, signaling a potential trend reversal or continuation of the larger uptrend.
📈 Breakout Confirmation
Price broke above the wedge and closed strong, suggesting buying momentum is returning.
Breakouts from falling wedges typically aim for a measured move equal to the height of the wedge — potentially sending BTC higher.
🟦 Support Zones
$77,936 – Previously a strong support/resistance flip zone.
$74,402 – A key structural level. Price tested and bounced here before breakout.
Both zones acted as a springboard for the recent bullish move.
🟪 Resistance Zones
$95,000 – A prior top before the correction began. Likely to act as resistance again.
$105,000 – Final major resistance before potential new all-time highs.
📊 Volume
Noticeable spike in volume during breakout – confirms strong bullish interest and validates the wedge breakout.
📉 RSI (Relative Strength Index)
RSI is at 53.81, climbing steadily, and crossing above the moving average.
Indicates increasing bullish momentum, but not yet overbought — still room to grow.
✅ Conclusion / Trade Idea
BTC has broken out of a falling wedge, with momentum building.
Bullish targets:
$95,000 first
$105,000 next
Invalidation zone: Below $74,000, where the breakout would be considered failed.
🔔 Final Thoughts
This chart signals a bullish continuation for BTC as long as price holds above the wedge and support zones. Ideal for position trades or swing entries, especially on retests of breakout levels.

BTCUSD: Target 100KPrice is currently testing the major descending trendline.
A breakout and weekly close above the trendline would confirm a strong bullish continuation and mark the beginning of a new upward wave.
Breaking the trendline = bullish confirmation.
Failure to break = possible short-term pullback before another attempt.
Next Target Levels After Breakout:
1 : $118,476
2 : $136,753
3 : $161,132

BITCOIN Analysis: Potential Pullback and ContinuationCOINBASE:BTCUSD is currently trading within an ascending channel, reflecting a clear bullish structure. The price may pull back toward the lower boundary of the channel before potentially continuing higher. This dynamic support offers a confluence area for a possible bullish reaction. A successful retest here could open the path for a move toward the $102,000 level, which aligns with the upper boundary of the channel and represents a logical bullish target.
However, a failure to hold this dynamic support could indicate weakening bullish momentum and may shift the short-term bias to neutral or bearish.
Traders should watch for confirmation signals such as bullish engulfing patterns, strong rejection wicks at the lower trendline, or increasing volume on the bounce before considering long positions.
Let me know your thoughts or if you see it differently! 🚀

btc . tue . recap plan to LONG came to fruition
LONG note:
as i found wOpen heavily BULLISH - i was eager to get in early and equaly positioned:
cw0.5 . 94.200
to
cw0 . 92781
entry: 93.975
this left me with not the nicest entry . not all orders were filled . should have favoured increasing order size . one never really knows until it happens . but happy
DAY TRADE note:
a day trade of nysOpen SFP . 95.400 (to ride down for our LONG IDEA)
LONG SUPPORT will show during the day . NICE! . but not taken . it supported our search for LONG though
recap
wOpen . ASIA . LONG
nysOpen . SFP to 5.30pm . LONG
tueOpen . ASIA take profit . rotation to cw0.5 . (LONG in favour)
nysOpen . idealy tp1 : SFP . possibly rotation . (look out for SHORT and LONG)

BTCUSD:Adopt range trading before the breakout.Given that a number of important data are about to be released intensively, the market volatility is rising sharply. Before a clear breakout signal in the price is formed, it is recommended that within the range of $93,000 - $96,000, the range trading strategy be flexibly applied: sell at highs, and then buy at lows to build positions when the price drops back to the support level, so as to seize the band trading opportunities in the volatile market. At the same time, strictly control the position size to prevent the risk of sudden and significant fluctuations triggered by the data release.
In the future, we will continue to monitor the market changes and update the trading strategies in real time.
I am committed to sharing trading signals every day. Among them, real-time signals will be flexibly pushed according to market dynamics. All the signals sent out last week accurately matched the market trends, helping numerous traders achieve substantial profits. Regardless of your previous investment performance, I believe that with the support of my professional strategies and timely signals, I will surely be able to assist you in breaking through investment bottlenecks and achieving new breakthroughs in the trading field.

Bullish Continuation Setup with Fibonacci Support and Breakout Trend: Bullish
Key Supports: 89916, 88513, 86517 (Fibonacci Levels)
Key Resistance: 94000–96000
Strategy: Buy pullbacks or breakouts with confirmation
This 4-hour chart of Bitcoin (BTCUSD) showcases a bullish market structure with successive higher lows and ascending channels, indicating a strong uptrend. A Fibonacci retracement tool has been applied from the recent swing low to swing high, highlighting key support and resistance levels. The price action shows breakout movements after minor consolidations, respecting bullish flag patterns. Currently, BTCUSD is consolidating near a major resistance zone (94,000–96,000), while the 0.5–0.618 Fibonacci levels below offer potential support areas for pullbacks. Key buy signals based on structure and Fibonacci retracement are identified and noted."

Bitcoin on a new bull run!Technicals are aligning for a new rally. I'm watching to see price drop to the level on the chart and rally from there

BTC? my POV on everythin else
WHAT DO YOU FEEL
When you buy something and it goes down?
Loss is buy high and SOLD low, visa versa.
I'm not insinuating that you should loose but what you should reflect on yourself,
When you made that decision to Invest or trade.
The length of time for it to get there, volatility, range. Account size
Main thing for me is my emotional position : MY EXPECTATION
I'm sorry to upset the guru
All other people analysis and mine will fit individually.
It will not fit the world.. analysis for 3mo-- > will not tally " you who trade intraday"
analysis for today___> won't fit "those invest for 6mo"
Again... find what fits your profile.. how patience? how long you are willing to wait? if it goes to target.. how satisfied will you be on your exposure?
Too long.. of my view. Hope this reach someone.
Not your guru.. but I could be a friend
My POV dont matter.. haha

Ready to print higher lowMy guess is that price is ready for a retrace to 80k. But I don't have any crystal balls over here. Just normal ones, so 50/50 I'm right. GL

Bearish ScenarioI'm seeing a possible Bearish Harmonic White Swan Pattern that would most likely take out the liquidity at 99.5k.. A possible short set up for this assuming the top is in..invalidation of this will be the ATH..

Bitcoin surpasses Google: Why BTC rallied to $94,000In April 2025, Bitcoin once again captured the spotlight by breaking above $94,000, reaching a market capitalization of $1.86 trillion. This surge pushed BTC ahead of Alphabet (Google’s parent company), making it the fifth-largest asset in the world.
The impressive rally in Bitcoin this year has been fueled by a combination of macroeconomic factors and developments within the crypto space itself. New financial instruments, political shifts, and technological advancements have made Bitcoin more appealing and accessible to a wide range of investors.
5 key drivers behind Bitcoin’s growth in 2025:
1. Approval of spot Bitcoin ETFs in the U.S.: For the first time, the SEC greenlit spot Bitcoin ETFs, allowing major institutional players to gain exposure through regulated investment products. This triggered a significant inflow of capital into the crypto market.
2. Weakening dollar and stock market declines: As global economic growth slowed and the U.S. dollar lost ground, Bitcoin emerged as a hedge asset — often compared to gold — with investors seeking safer alternatives to traditional markets.
3. Pro-crypto political climate in the U.S.: The new U.S. administration has adopted a supportive stance on crypto, easing regulations and even announcing plans to build national crypto reserves. This strengthened investor confidence across the market.
4. Bitcoin’s growing role as ‘Digital Gold’: The perception of Bitcoin as a long-term store of value continues to rise. More large investors and corporations are now including BTC in their asset diversification strategies.
5. Technological advancements: The rollout of second-layer solutions like the Lightning Network has made Bitcoin transactions faster and cheaper. This has improved real-world usability and expanded the global user base.
In 2025, Bitcoin continues to gain momentum, breaking new records and cementing its role as one of the world’s most important financial assets. The combination of spot ETF approvals, political backing, macroeconomic shifts, and ongoing tech innovation has created fertile ground for its growth. With each passing day, BTC becomes increasingly attractive to both institutional and retail investors — setting the stage for further gains in the coming years.
Still, Bitcoin’s future will depend on how crypto regulations evolve, the pace of technological breakthroughs, and global economic conditions.

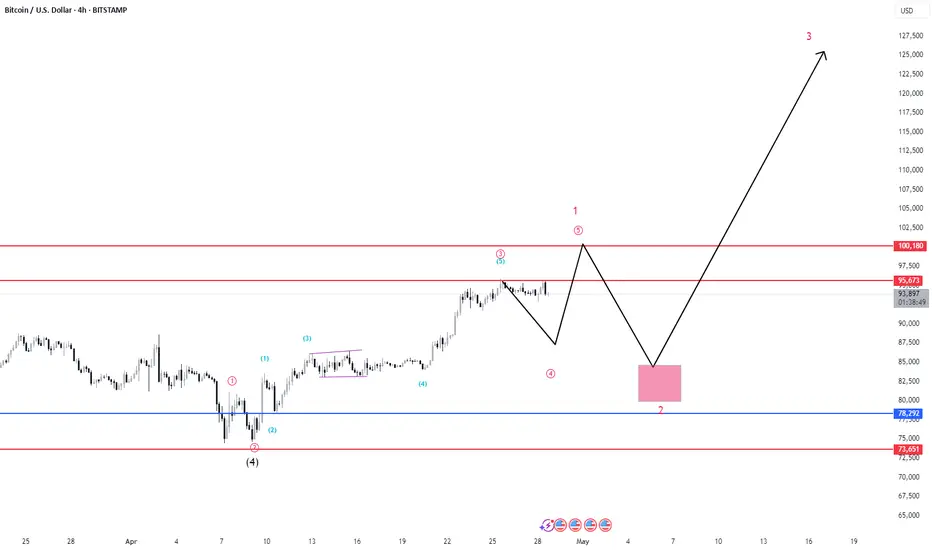
BTCUSD ANTICIPATED FORCUSTUsing elliott wave analysis looking for bitcoin come back lower before we push higher, that is after completing wave 1 to came back for wave 2 then push higher for wave 3, 4 and 5 respectively.
BTC update Chart Analysis. Breaking this Market down today and going to High time frames with it using
Fvg,Liquidity, trend lines. I do see BTC going to 67k next just off the fact that Daily broke support trend and has retraced to its FVG that supports the break of trend. I'll follow up down the line after this market breaks Weekly trend and see what it will do then. safe trading everyone.


