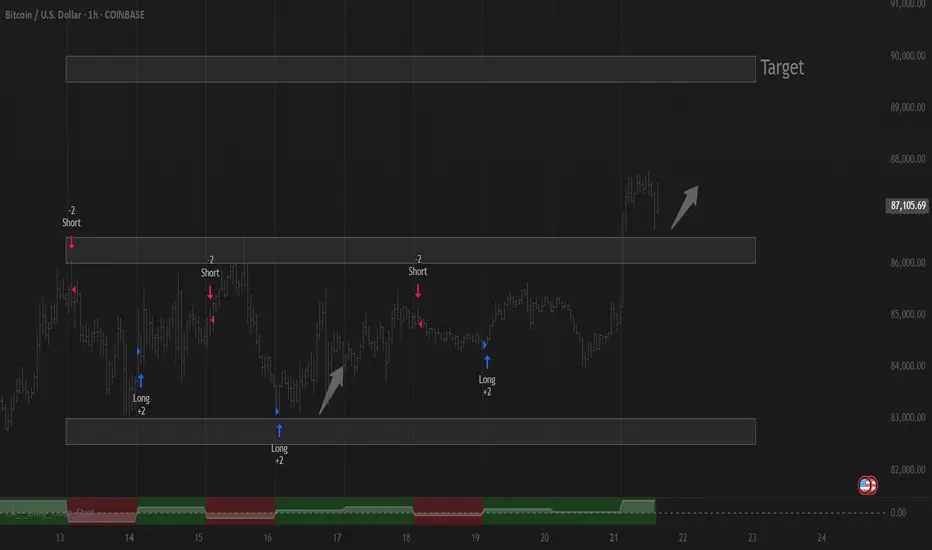
What is next move on bitcoin ?I’ve marked out how I’m currently viewing BTC price action. Are we about to see a breakout or a rejection at resistance + my TWT pattern (which I use for pullbacks)?
No position for now — waiting for confirmation. If we get a clean breakout, I’ll be watching for a long on a break & retest. But if we see a strong 4H rejection, I’ll be looking for a short-term trade on the lower timeframes. Let’s see what the market gives us. 👀
BEARUSD trade ideas

Risk-averse funds drive BTC higher.The sharp collapse of the DXY has triggered violent fluctuations in the global monetary system. As risk aversion heats up, investors are adjusting their asset allocations, with substantial capital flowing into "digital gold," which has enabled BTC to break last week's sideways consolidation and initiate an upward trend.
BTCUSD
buy@86500-87500
tp:88500-89500
I hope this strategy will be helpful to you.
When you find yourself in a difficult situation and at a loss in trading, don't face it alone. Please get in touch with me. I'm always ready to fight side by side with you, avoid risks, and embark on a new journey towards stable profits.

BTC 2Day chartPlain and simple here
We clear this level at 88.7k
It’s onward …
Failing ..then more downward action.
Lending more bullish trend.

Market liquidity update April 22nd Short update about where the liquidity is being hedged off by Market Makers.
As of yesterday we have seen much more correlation in the CME futures as CFDs in Europe are being traded less.
Irregular and Time-Layered Liquidity Indicators

(BTC) bitcoin "signs"the blue/green line is crossing the purple dotted line. This is a sign representing a transitional phase between moving averages where the short line begins to cross over the patterns of longer time frames. I was looking at this today and though any indicator is never 100% accurate it is always better to see positive signs rather than no signs at all. Could this be the summer of crypto? A positive crypto summer unlike so many previous years? I'm well aware the second quarter just started and summer is not close by 3 months time.

BTC D1 has not yet reached its peak?BTC D1 has not yet reached its peak.
Currently, the Long peak for BTC is on the D1 timeframe, and D1 continues to confirm upward movement each day. Probing for the D1 peak has not yet confirmed a top.

Falling towards 61.8% Fibonacci support?The Bitcoin (BTC/USD) is falling towards the pivot and could bounce to the 1st resistance which is a pullback resistance.
Pivot: 85,389.36
1st Support: 83,252.81
1st Resistance: 92,478.49
Risk Warning:
Trading Forex and CFDs carries a high level of risk to your capital and you should only trade with money you can afford to lose. Trading Forex and CFDs may not be suitable for all investors, so please ensure that you fully understand the risks involved and seek independent advice if necessary.
Disclaimer:
The above opinions given constitute general market commentary, and do not constitute the opinion or advice of IC Markets or any form of personal or investment advice.
Any opinions, news, research, analyses, prices, other information, or links to third-party sites contained on this website are provided on an "as-is" basis, are intended only to be informative, is not an advice nor a recommendation, nor research, or a record of our trading prices, or an offer of, or solicitation for a transaction in any financial instrument and thus should not be treated as such. The information provided does not involve any specific investment objectives, financial situation and needs of any specific person who may receive it. Please be aware, that past performance is not a reliable indicator of future performance and/or results. Past Performance or Forward-looking scenarios based upon the reasonable beliefs of the third-party provider are not a guarantee of future performance. Actual results may differ materially from those anticipated in forward-looking or past performance statements. IC Markets makes no representation or warranty and assumes no liability as to the accuracy or completeness of the information provided, nor any loss arising from any investment based on a recommendation, forecast or any information supplied by any third-party.

BITCOIN ..... 3....2....1.... LIFT OFFBitcoin is about to Surge big time with a quick move to near $98,500. The set up seems clear and is unfolding nicely. Its likely to run into major resistance at $98,500 - $102,000. So it will get choppy up there and stall out for a while. Stay tuned to what comes next?????

4/21 - Bitcoin Update on Elliot Waves: Reversal Time?Just dropping this quick update on the Bitcoin analysis before nap time.
See yall next time!

The sideways trading range of BTC has shifted upwardsBTCUSD has been fluctuating sideways for a long time 📊. The accumulated upward momentum has successfully broken through 87000 🚀! It has reached 88500 🎉. In the future, the fluctuation range is likely to be raised to between 85500 and 88500 📈. Keep paying attention 👀!
💰💰💰 BTCUSD💰💰💰
🎯 Sell@88500 - 88000
🎯 TP 86500 - 85500
Traders, if you're fond of this perspective or have your own insights regarding it, feel free to share in the comments. I'm really looking forward to reading your thoughts! 🤗
👇The accuracy rate of our daily signals has remained above 98% within a month! 📈 We sincerely welcome you to join our channel and share in the success with us! 🌟


Bitcoin (BTC) Price Projection Based on Previous Halving CyclesHistorical Context:
After each previous halving, Bitcoin has entered a strong bull market, typically peaking 12 to 18 months later:
• 2012 halving → ATH in late 2013
• 2016 halving → ATH in late 2017
• 2020 halving → ATH in late 2021
Assuming the latest halving occurred around April 2024, BTC is now in the early phase of what could be the next major bull run.
Current Technicals:
• Current Price: $87,273.26
• Weekly Change: +2.46%
• The chart shows:
• A breakout above descending resistance (yellow trend lines)
• A potential bullish continuation pattern
• Support around $85,000 holding strong
Projection:
• If Bitcoin follows the same post-halving trajectory, a new all-time high (ATH) could be expected between $120,000 and $150,000 sometime in late 2025 or early 2026.
• The current range between $80,000 and $90,000 may represent a consolidation zone before a major breakout.
• The “Up” signal and positive momentum suggest an ongoing upward move.

Looks like a solid break of downtrend..... I think we go higherThis downtrend has been extremely well respected for past 2 months... Its like its been broken and sustained to the upside....

4 Analyses with 100% sensitivityBTCUSD - LTCUSD - ETHUSD - XRPUSD
I suggest that if you want to see the strongest price support in these 4 currencies, check out the analysis I posted for these currencies in the past months.

btc fibonacci levels Btc has hit 88141 level needs to hold 87799 clean close above 88141 green candle buy lock in profits at levels im still looking for 92212 but we will see some volatility when we get into next gann fan around 89934 level

BTCUSD 30M CHART PATTERNThis chart shows a BTC/USD (Bitcoin to US Dollar) trading setup on the 30-minute timeframe. Here's a breakdown of what it's indicating:
1. Pattern Formation: A potential bullish flag or ascending triangle setup is forming after a strong upward move, suggesting continuation.
2. Entry Point: The chart suggests a breakout above the consolidation zone (the horizontal blue line) as a possible buy signal.
3. Take Profit Targets:
First Take Profit: Just above the breakout zone.
Second Take Profit: At a projected target based on the previous bullish move (the "flagpole" height).
4. Stop Loss: Placed below the support zone (highlighted in red), protecting the trade if price breaks down instead.
5. Current Price: Around $87,106, just below the breakout level.
This is a classic risk/reward setup traders use for continuation plays. Do you want help calculating the exact entry, stop loss, and target levels based on this chart?

Trading balanceTrading balance The price of the asset has rebounded from the balance zone. With the prospect of growth into the resistance zone.
BTC RESISTANCESMight have some reaction when the levels got hit. Let's see and review it in the future.
based on just price level and price reactions

uptrendGiven the completion of the corrective pattern and the breakdown of the resistance trend line, we are expected to witness the beginning of the upward trend.

BTC/USD Rallies Above $82,140FenzoFx—Bitcoin has surged past $82,140 resistance and is now trading near $86,800, correcting 1.0% of its recent gains.
The bullish trend persists above the 50-period simple moving average, with immediate support at $86,140 offering a potential entry point for buyers. If this level holds, the uptrend could target $89,000.
Conversely, a dip below $86,140 might push prices toward $84,000 or $82,811.
>>> No Deposit Bonus
>>> %100 Deposit Bonus
>>> Forex Analysis Contest
All at FenzoFx Decentralized Forex Broker

BTC is crossing 87000 crucial levelIf BTC will close above 87000 today, it is high chance to cross 91000 mark.
Note: This is not a buy sell call, trade at your own will, use stop loss.

BTC, THE ONLY ONE THAT WORTH LONGING !Introduction
Crypto Didn’t Make It — Just Admit It
Long positions in crypto are usually pointless and super risky, because crypto simply didn’t make it .
Think of it like the dot-com era—when every company with a website was booming… until they all turned to dust .So there won’t be another altseason.
Crypto had its own version of that in 2021 . Unfortunately, it didn’t deliver anything meaningful to the world. Just sh!tcoin after sh!tcoin.
And let’s be clear: I’m talking about everything except Bitcoin .
The rest? Still pointless. Still super risky. At least until blockchain tech becomes much faster , more advanced, and actually gets used in real, profitable projects that benefit stakeholders — not just hype and tokenomics.
Who am I to say that? Just a trader since 2017 and a blockchain developer (not your average “Web3 dev” who just learned how to deploy a token).
BTC looks primed for a long.
Weekly EMA 55 (orange line) is the key — price above it = bullish, below = bearish. Simple as that.
Right now, BTC is holding strong above it and looks ready to move.
(And yeah, crypto doesn’t care about world news — remember that.)
Entry: ~76,500
Stop Loss: 69,217
Targets:
TP1: 87,196
TP2: 93,985
TP3: 101,900
TP4: 115,534

Bitcoin - Is Bitcoin on the way up?!Bitcoin is above the EMA50 and EMA200 on the four-hour timeframe and has broken out of its descending channel. The continuation of Bitcoin’s upward trend will depend on maintaining the drawn upward trend line.
A valid break of this trend line will cause Bitcoin’s price to correct to the 80,000 range. It should be noted that there is a possibility of heavy fluctuations and shadows due to the movement of whales in the market and compliance with capital management in the cryptocurrency market will be more important. If the downward trend continues, we can buy within the demand range.
Following the announcement of new trade tariffs by the United States, Bitcoin experienced a 16.7% drop in price. However, it partially recovered from its 26.7% plunge. The total global cryptocurrency market capitalization has now reached $2.74 trillion, marking a 1.71% increase compared to the previous day.
Over the past 24 hours, the total crypto market trading volume hit $60.7 billion, reflecting a 32.28% rise. Within this, DeFi transactions account for $5.25 billion, making up 8.65% of the total 24-hour market volume. Meanwhile, stablecoins have dominated trading activity with $55.84 billion in volume, representing 92% of the total market volume for the day.
When comparing Bitcoin’s performance to other major assets, gold leads with a 12.9% gain. In contrast, both silver and the U.S. Dollar Index saw a 4.8% decline. The S&P 500 fell by 13.8%, while the Nasdaq dropped 17.5%. Despite its volatility, Bitcoin sits between oil and the Nasdaq in performance, showing signs of partial recovery. However, its behavior still diverges from that of traditional safe-haven assets like gold.
On the political front, Hong Joon-pyo, a presidential candidate from South Korea’s conservative party, pledged that if elected, he would implement reforms in blockchain and cryptocurrency regulations. He also promised to integrate blockchain technology into public sector and administrative services. Additionally, Hong plans to invest at least 50 trillion Korean won (approximately $35.1 billion) over the next five years in research and development across artificial intelligence, quantum technology, and room-temperature superconductors. These initiatives are part of his broader strategy focused on growth driven by emerging technologies.
In Q1 2025, publicly traded companies collectively acquired 95,431 bitcoins, bringing their total holdings to 688,000 BTC. This amount represents 3.28% of Bitcoin’s fixed supply of 21 million coins.
The Coinbase Premium Index, which tracks the difference in Bitcoin demand between U.S. markets and global exchanges, has shown reduced volatility since March 2024. It appears to be forming a pattern often seen before bullish market trends.
Robert Kiyosaki, renowned entrepreneur and author of the best-selling book Rich Dad Poor Dad, has forecasted that Bitcoin’s price could rise to between $180,000 and $200,000 by the end of 2025. Kiyosaki has long been an outspoken supporter of Bitcoin, portraying it as a safe hedge against inflation and economic instability.
