BTC showing a Bull Flag PatternBTC showing a Bull Flag Pattern if this pattern works we can see BTC retest level at 105k for now btc must hold support area at 92k level
A bullish triangle breakout above resistance could signal further upward movement
Conclusion:
Bullish Outlook: If Bitcoin breaks through the $95,000-$100,000 resistance, it could continue moving toward $110,000 and higher, assuming volume remains strong.
Bearish Reversal Risk: If Bitcoin fails to maintain momentum and drops below the support zone around $90,000, a pullback toward $80,000 or lower could be likely.
With Bitcoin trading at $93,852, this represents a significant price level. Let’s dive into a technical analysis based on this new price point. Here's how we can break it down:
1. Price Action Overview:
Current Trend: Given that Bitcoin is trading above $90,000, it’s in a very strong bullish phase (assuming this price is recent and not a flash spike). Bitcoin has likely been in an uptrend for some time if it's at this price point.
Price History: Look back at recent highs and lows. Is $93,852 a new all-time high? If so, it may suggest a continuation of the bullish trend or a potential retracement (correction).
2. Support and Resistance Levels:
Support Levels:
$85,000 - $90,000: This could serve as a near-term support level, as psychological levels tend to hold. Watch for price action around this level to see if it holds.
$80,000: A previous significant level, possibly acting as a major support.
Resistance Levels:
$95,000 - $100,000: These could be the next key resistance levels. If Bitcoin has not yet reached $100,000, it’s likely to encounter some selling pressure around this psychological threshold.
All-Time High: If this is the highest price Bitcoin has reached (or is close), it may face resistance as traders take profits.
3. Technical Indicators:
Moving Averages (MA):
50-Day MA: If Bitcoin is above the 50-Day Moving Average (likely the case if it’s at $93,852), this indicates a short-term bullish trend.
200-Day MA: If Bitcoin is significantly above the 200-Day MA (possibly $50,000–$60,000, depending on the trend), this suggests that the long-term trend is still bullish.
Crossovers: If the price is above both MAs, the trend is solidly bullish. A potential golden cross (50MA crossing above the 200MA) would further validate this upward trend.
Relative Strength Index (RSI):
RSI at 70 or above: If the RSI is near or above 70, Bitcoin may be entering overbought territory. This could signal that the price might face some retracement or consolidation.
RSI at 50-70: This indicates healthy momentum, and Bitcoin is still in an uptrend without signs of being overextended yet.
MACD (Moving Average Convergence Divergence):
Bullish Crossover: If the MACD line is above the signal line, it indicates positive momentum and buying pressure.
Bearish Crossover: If the MACD crosses below the signal line, it may suggest a slowdown or potential pullback. Look for any divergence between price and MACD, as it may signal an upcoming reversal.
Volume:
Increasing Volume: If Bitcoin is moving up with increasing volume, this suggests strong market participation, which is a good sign for the uptrend continuing.
Decreasing Volume: If volume is tapering off during an uptrend, this might indicate weakening momentum, and a reversal or consolidation might be coming.
4. Chart Patterns:
Bullish Continuation Patterns:
Look for bull flags or ascending triangles. These patterns indicate that after a period of consolidation, Bitcoin might continue its upward trajectory.
Reversal Patterns: If Bitcoin is forming head and shoulders, double top, or bearish divergence with high RSI, that could signal a potential reversal or correction in the near future.
5. Sentiment and Market Conditions:
Fear and Greed Index: If the Fear & Greed Index is in the “Extreme Greed” zone, this might indicate that the market is overbought, and a short-term correction could be on the horizon.
On-Chain Data: Look for any data showing whether large players (whales) are buying or selling at these levels. If whales are accumulating, it might suggest continued bullishness.
6. Potential Price Targets:
Upside Potential:
$95,000 - $100,000: This is likely the next resistance zone. If Bitcoin breaks through this range with strong momentum, it could be headed towards $110,000 or even higher, depending on how the market reacts.
Downside Risk:
$85,000 - $90,000: These levels might act as strong support. If Bitcoin breaks below $90,000, the next level of support would be around $80,000.
If it falls below $80,000, this would signal a deeper correction, and we would need to watch for further support at $70,000 and $60,000.
7. Fundamental Factors to Consider:
Global Market Sentiment: Bitcoin’s price is often influenced by traditional financial markets, especially during macroeconomic events (inflation data, interest rate changes, etc.). Pay attention to how equities, gold, and other assets are performing, as Bitcoin often moves with these.
Regulation News: Any regulatory developments, especially in the US or Europe, can have a major impact on Bitcoin’s price.
Institutional Adoption: News of large institutions or corporations adopting Bitcoin can drive the price higher. Similarly, any reports of significant sell-offs by large holders can trigger a downward price movement.
BEARUSD trade ideas

Fearless Bulls Bought the Dip! The 75-80K range finally delivered as a strong support zone — just as anticipated.
Back in January, I marked this area as "A Sweet Spot to Pull Back," and today’s price action validates that foresight.
What's even more impressive? Bitcoin absorbed the selling pressure on both April 3rd and 4th like a champ.
Now, the 400-day EMA is stepping up as dynamic support, adding further conviction to the bullish case.

CHECK BTCUSD SIGNAL ANALYSIS (1H) | CHECK THE CAPTION BELOWBTCUSD - Trade Signal Setup
Type: Long (Buy)
Entry Zone: 94,683 - 94,736
Targets:
🎯 Target 1: 95,050
🎯 Target 2: 95,200
🎯 Target 3: 95,400
Stop Loss: 94,454
Plan: Enter on confirmation in the Entry Zone.
Move SL to breakeven after hitting Target 1.
Manage risk properly!
Disclaimer:
Not financial advice. Always DYOR!

BTCUSD (4H): Short Position OpportunityHello Traders.
You may find more details in the chart!
Good Luck!
Please support with a like or comment if you find this analysis useful.❤️

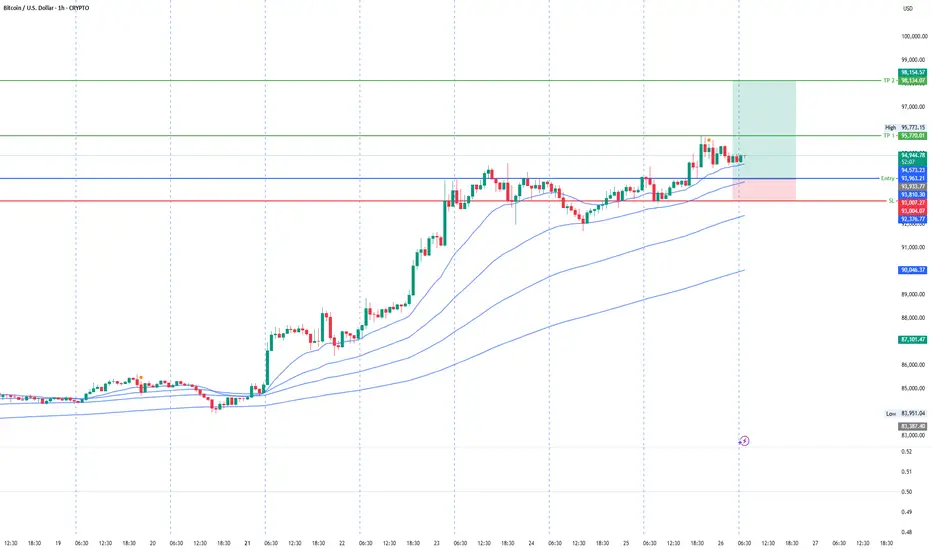
Bulls Warming Up! BTC Aiming Higher – Are You Ready?Hi traders! Analyzing BTC/USD on the 1H timeframe, price is moving within a rising channel and finding support at key EMA levels.
🔹 Entry: 94,115
🔹 TP: 96,005
🔹 SL: 92,225
BTC is holding above the 100 EMA and respecting the lower boundary of the ascending channel. As long as price stays above 93,300, the bullish structure remains intact, pointing towards a potential move to the 96,000 area.
Volume remains stable, and the trend detector continues to signal a bullish bias. A break and close above 94,400 would strengthen the bullish momentum!
Watching closely for a confirmation of strength!
⚠️ DISCLAIMER: This is not financial advice. Every trader must evaluate their own risk and strategy.

TA for FX,Indices and many More!(Week 17,28Apr25)Hello fellow traders , my regular and new friends!
Which pairs or instruments should we keep a look out for?
For me I am looking at :
potentially more pullback (down) on EURUSD and the majors.(stronger USD)
SNP might have a day or 2 of upside and pullback (chance for long on the change in daily trend)
Potential H&S on EurGbp and Gold.
BTC to see potential long if there's decent pullback.
NFP this week, BOJ interest rate release as well! Take note!
Do check out my recorded video for more insights!
Do Like and Boost if you have learnt something and enjoyed the content, thank you!
-- Get the right tools and an experienced Guide, you WILL navigate your way out of this "Dangerous Jungle"! --


Could go either way...Could go up or down despite what people say, react to bitcoin or hold long term, don't try to predict the market like most people.

The most simple BTC time chartThis simple chart have been working for many years, now the expectation is around Dec 2025

Weekly Support for BitcoinYou can check this Chart for your referrence we have weekly support around price 85k level if this level can hold or stay for 1 month we are surely Bullish for bitcoin.
As of April 26, 2025, Bitcoin (BTC) is trading at approximately $94,032 USD, reflecting a slight decrease of about 1.1% over the past 24 hours. Despite this minor dip, Bitcoin has experienced a notable upward trend, gaining nearly 10% over the past week and approaching the significant $95,000 resistance level.
Fundamental Analysis
The recent surge in Bitcoin's price is influenced by several factors:
Geopolitical Developments: A recent call between U.S. President Donald Trump and Chinese President Xi Jinping to discuss trade tariffs has positively impacted market sentiment, contributing to a rally in risk assets, including cryptocurrencies.
Institutional Interest: The Federal Reserve's rollback of certain regulations has made it easier for Wall Street institutions to engage with Bitcoin and other cryptocurrencies, potentially increasing institutional investment.
Forbes
Market Predictions: Notable figures like Robert Kiyosaki have set optimistic price targets for Bitcoin, with Kiyosaki predicting it could reach $180,000 to $200,000 by the end of 2025.
Binance
However, technical analysis indicates that Bitcoin is forming a bearish triangle pattern, suggesting potential resistance around the $95,000 mark. If the price fails to break through this resistance, it could lead to a short-term pullback.
In summary, while Bitcoin's current trajectory is upward, investors should remain cautious and monitor both technical indicators and geopolitical developments that could influence its price movement.
If you like my content Analysis Please follow me :) Thank you for support I'll be giving more daily updates on this page if I got more followers here By the way I started Crypto Trading since 2014 11 Year's now in this Trading Journey I would like to give more Idea's for you guys

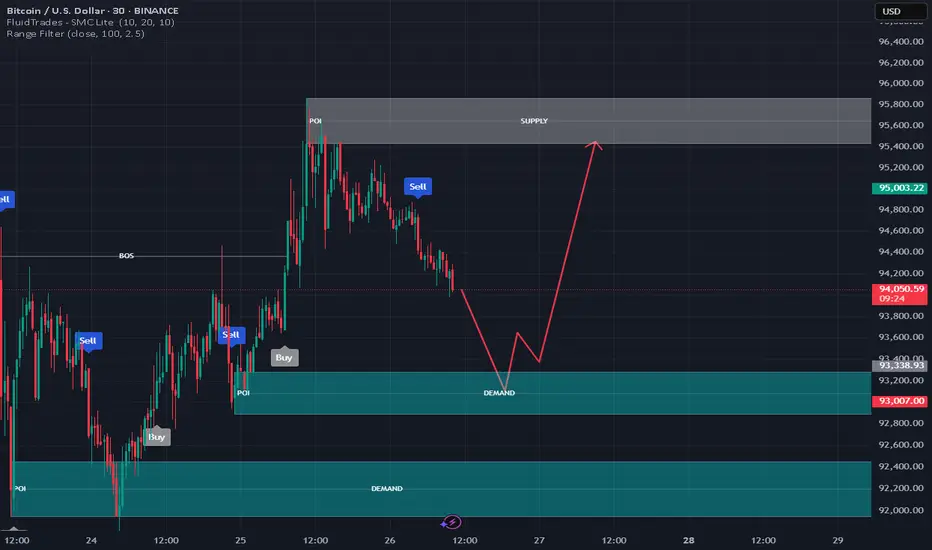
Trade Plan for BTC/USD (30-Minute Timeframe)Market Context:
Price is currently in a downtrend, heading toward a strong demand zone.
There is a major supply zone above where selling pressure previously pushed the price down.
Entry Plan:
🔵 Buy Entry:
Wait for price to tap into the Demand Zone (around 93,000–93,400 USD).
Look for bullish confirmation (e.g., bullish engulfing candle, strong rejection wick, or structure break on lower timeframes like 5-min).
Enter a buy trade once confirmation appears.
🔴 Sell Entry:
If price reaches the Supply Zone (around 95,400–95,800 USD), wait for bearish confirmation (e.g., bearish engulfing, rejection candles).
Consider selling if bearish signs are strong.
Stop Loss:
✅ For Buy Trade:
Below the Demand Zone (~92,800 USD), giving enough room for volatility.
✅ For Sell Trade:
Above the Supply Zone (~95,900 USD).
Take Profit Targets:
🎯 Buy Trade TP:
First Target: Previous minor resistance (~94,600 USD)
Final Target: Supply Zone (~95,400–95,800 USD)
🎯 Sell Trade TP:
First Target: Minor support (~94,600 USD)
Final Target: Back to Demand Zone (~93,400 USD)
Risk Management:
Risk only 1–2% of your trading account per trade.
Adjust position size according to stop loss distance.
Maintain Risk-Reward Ratio of at least 1:2 or better.
Important Reminder:
Always wait for clear confirmation signals before entering. Avoid forcing trades. Manage emotions and stick to your plan!
BTCUSD: Trading Signal From Our Team
BTCUSD
- Classic bearish pattern
- Our team expects retracement
SUGGESTED TRADE:
Swing Trade
Sell BTCUSD
Entry - 95407
Stop - 99310
Take - 88838
Our Risk - 1%
Start protection of your profits from lower levels
Disclosure: I am part of Trade Nation's Influencer program and receive a monthly fee for using their TradingView charts in my analysis.
❤️ Please, support our work with like & comment! ❤️


Bitcoin at Key Decision Point – Two Scenarios in PlayBitcoin is approaching a major trendline resistance after a strong rally.
At this stage, I see two possible scenarios:
1️⃣ Scenario 1 (More Likely):
Price could reject from this resistance zone, triggering a pullback toward the lower blue trendline support. This move would sweep liquidity, reset the market, and set up the next bullish leg.
2️⃣ Scenario 2:
If bulls manage to break above the resistance without a deeper pullback, we could see a continuation toward new all-time highs around 114k.
However, given the extended rally and weakening momentum, a correction first seems more natural.
⚡ I'm watching for reaction around the resistance and the orange zones for confirmation.
Patience is key — no need to chase!

BTC buy scalpBreakout on H1, Looking for pullback to my entry area, bullish engulf on m1 should be the confirmation.

Bitcoin(BTC/USD) Daily Chart Analysis For Week of April 25, 2025Technical Analysis and Outlook:
Bitcoin experienced a significant rally in this week's trading session, breaking through all identified Mean Resistance levels: 86400, 90600, and 94500. This breakout led to the completion of the Interim Coin Rally at 88400. As a result, the newest identified Interim Coin Rally at 95000 has also been completed, indicating a possible pullback to the Mean Support at 92000 and a further decline potential toward an additional Mean Support target at 88500. However, it's important to recognize the chance of upward momentum emerging from a retest of the completed Interim Coin Rally at 95000, which could advance toward the next Interim Coin Rally at 100000.

BTC on high time frame
"Hello, focusing on BTC on high time frames, the price has pulled back to a significant zone around $75,000 and is currently showing bullish momentum. The next target appears to be the 4-hour order block located at $98,000."
If you need further assistance or have any specific questions, feel free to ask!

BTC is ready to blast
1. Here VOLUME totally compressed in 4 hrs time line chart and price is consolidating some what.
2.rsi is not breaking 60 level and adx is smoothed above 25 level
3.ketller channel is showing for not over bought or not oversold zone
conclusion : if price is break 96000 level it will move to monthly and quarterly resistant 102500 and this will be its first stop
This setup reflects a classic smart money concept, liquidity engineering followed by a return to inefficiency. The trade idea rests on the premise that markets rarely move in a straight line and often seek to rebalance themselves after aggressive trends. By allowing price to sweep the highs, fill the imbalance, and re-establish support, we can position ourselves with the trend in a favorable risk-reward context. The bias remains bullish, but execution depends on price reaction at key levels and confirmation of intent.

BTCUSD show signs of reversal with break of Trendline.BTCUSD show signs of reversal with break of downTrendline.

Bitcoin (BTC/USD) - Cup and Handle Breakout🔍 Pattern Identified: Cup ☕ & Handle 🏆 Pattern
🕒 Timeframe: 1-Hour Chart (1H)
💥 Breakout Level: Around $95,000
🎯 Projected Target: $97,073.75
📈 Technical Overview:
Bitcoin formed a rounded cup showing accumulation at lower levels.
After completing the cup, a small pullback (handle) indicated a healthy consolidation.
A strong breakout above the neckline resistance confirms the bullish pattern.
⚡ Actionable Insights:
As long as the price stays above the neckline, momentum remains positive.
A breakout generally leads to a strong continuation rally towards the projected target.
📊 Watch for volume confirmation for added strength.
⚠️ Caution if price slips back below the neckline – breakout may invalidate.
Disclosure: I am part of TradeNation's Influencer program and receive a monthly fee for using their TradingView charts in my analysis.

$BTC Positive Scenario & Recovery Strength... 4/26/2025CRYPTOCAP:BTC Positive Scenario & Recovery Strength...
50-D SMA: Cleared
38.2% of the recent decline ($88,506): Cleared
100-D SMA: Cleared
61.8% of the recent decline ($96,904): Underway, LHU! 😅
Full recovery of the recent decline ($109,665): YTS
Positive Scenario Target ($127,845): YTS
Cheers!

Bullish Trend Continues upto 98KUnder current market conditions, the area near 93929 has been identified as a critical support zone, where the AI model detects a high-probability trade setup.
Suppose the market demonstrates increased volume and price stability above key moving averages in the 93929 area. In that case, traders are advised to monitor for trend-continuation entry opportunities in alignment with the prevailing momentum.
Profit targets are defined at 95764 and 98143, corresponding to logical technical resistance zones. These levels are designed for staged profit-taking across different trade management styles. Stop-loss should be strictly enforced at the designated level; once breached, the strategy is considered invalidated to limit potential downside.
BTCUSD SellBitcoin 1 hour chart, consolidation between 91900-94600 levels. Now we have sell signal and target is support zone. Risk reward 1/3
