BTC/USD: Hero's Quest to the Boss Treasure BTC/USD: Hero's Quest to the Boss Treasure
Price Action Deep Dive:
BTC/USD has formed a powerful SPAWN POINT breakout on the 4H timeframe, characterized by three consecutive blue candles with minimal wicks, indicating strong buyer control
Prior to the breakout, we observed a period of tight consolidation (level 15-20 grinding phase) where price was building energy for the current upward thrust
The breakout volume significantly exceeds previous candle volumes, confirming legitimate player interest in this upward move
Recent price structure shows higher lows and higher highs, establishing a clear uptrend path toward our target zones
Current candle formation suggests momentum continuation rather than exhaustion, with minimal upper wicks indicating buyers absorbing all selling pressure
Market Structure Context:
The breakout has successfully cleared the previous resistance zone (ELITE LvL 2 HP: 2), transforming it into support for future pullbacks
The Treasure Hunter color shift preceded this move, acting as an early warning signal for observant traders
Major support trendline from previous lows remains intact, providing a "regeneration shield" for any temporary retreats
Each pullback has been increasingly shallow, demonstrating growing reluctance from sellers to engage the hero's advance
The most recent consolidation formed a bull flag pattern before the continuation, classic "power-up charging" price action
With our Hero at Level 159 with full health and the Wizard's Journey already 53% complete, all technical indicators align for continued progress toward BOSS TREASURE around $94,000-$95,000, though we should remain vigilant for temporary pullbacks to the HEALTH POTION zone around $84,000.
BEARUSD trade ideas

Are You Backtesting or Backfilling Your Ego?You build the setup.
You run the test.
It’s not quite what you hoped for…
So you tweak it. Then tweak it again. Then again. And again.
Before you know it, you’re not testing a strategy anymore
you’re editing reality until it flatters you.
That’s not refinement.
That’s backfilling your ego.
The urge to make it look right
We’re human.
Nobody likes drawdowns.
Inconsistency feels uncomfortable.
And let’s be real.. win-rates under 50% just look bad.
We don’t want to see our promising idea fall apart in the data.
So instead of facing it, we start sculpting the results to make them easier to accept.
We don’t want to see our promising idea fall apart in the data.
So instead of facing it, we start sculpting the results to make them easier to accept.
Widen the stop just a little.
Tighten the take-profit, Perfect! Now my win-rate is 60%
Add a filter that “feels logical.”
Nudge the indicator setting.
Remove the choppy day, “that was news anyway.”
And just like that, the curve is smoother.
The stats are cleaner.
You feel better.
But here’s the problem:
You’re not building a strategy that works.
You’re building a strategy that looks like it works.
Optimization isn’t the enemy, but your intentions might be
Of course, tuning is part of the process.
You should test different inputs and variables.
But stop and ask yourself: why are you doing it?
If you're refining to understand the behavior of your system, that’s good.
If you're changing things to avoid discomfort? That’s not testing. That’s denial.
The market doesn’t care how hard you worked.
It doesn’t reward effort. It rewards resilience.
If your strategy only performs when everything’s perfectly aligned
when the moving average is exactly 13.53661,
and the RSI is 42.122 instead of 40,
and your entry is two bars after a wick touch…
Then you don’t have a strategy.
You have a sandcastle.
And when the tide shifts, it’s gone.
All because you wanted it to work so badly, you sculpted the data until it told you what you wanted to hear.
A strategy worth trading doesn’t just survive the good times
Anyone can build a system that performs in a trending market.
Or when volatility is ideal.
Or when the dataset ends right before the storm hits.
But markets don’t hand out clean conditions on demand.
So ask yourself:
Have you tested your strategy in stress conditions?
Have you run it through market noise, sideways action, volatility spikes, and traps?
Have you studied its worst stretch and still said, “Yes… I’d take these trades”?
Because if the answer is no, your system isn’t ready.
You’re not building a strategy to trade.
You’re building one to feel safe.. and that’s far more dangerous.
Break it before the market does
The best traders do the opposite of comfort:
They try to break their systems before live money does it for them.
Run a Monte Carlo simulation.
Shuffle the order of trades.
Randomize outcomes.
Apply slippage or missed entries.
If your equity curve collapses under that pressure, if your belief in the system evaporates when the trades aren’t perfectly sequenced, then you didn’t build robustness.
You built a lucky curve.
Loss streaks aren’t a bug, they’re the cost of playing
Too many traders design systems that avoid losing…
instead of building ones that know how to lose..
Every real edge has pain points.
Every equity curve has drawdowns.
Every stretch of performance has some ugly days.
If your backtest doesn’t show that? Be suspicious, because the market will definitely do.
So stop trying to eliminate every loss, and start asking better questions:
Where does this strategy actually break?
What’s the worst losing streak I can expect?
Can I survive that financially and emotionally?
bottom line:
It’s truth over comfort.
Clarity over illusion.
Edge over ego.
Test it honestly, or the market will ..

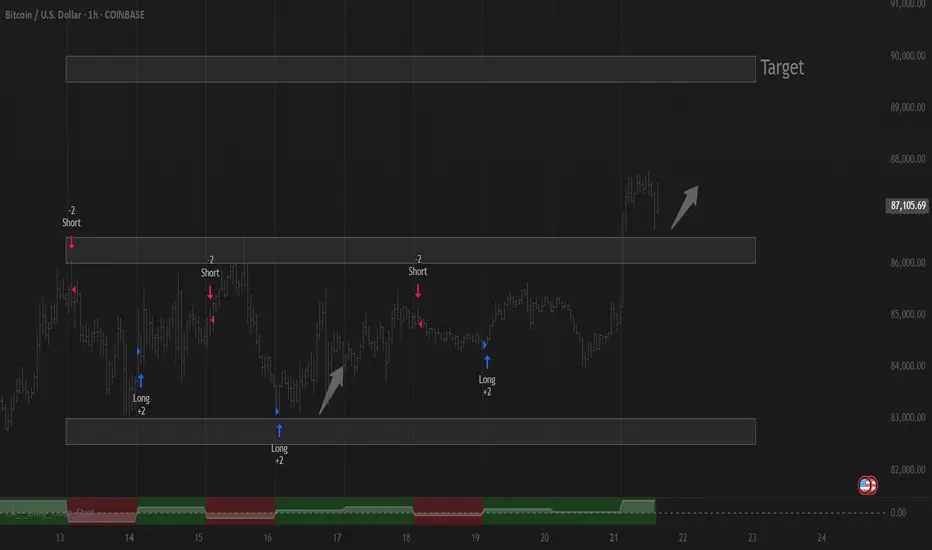
Bitcoin could surprise with new ATHs- one of the more tricky analysis since technically BTC could be in a HTF downtrend so looking for very high upside targets is not the best idea
- that said, there are some interesting developments here:
1. PA has broken the very clear downtrend line
2. S/R flip just recently confirmed on the 4H time-frame suggests the bull strength is real
3. perhaps most importantly, Bitcoin has traded differently to US equities for the last couple of days with SPX heading sharply lower but Bitcoin not really following and even rallying (something unheard of until this year!)
It is too early to tell whether this is a new dynamic between the two and certainly far too early to say that Bitcoin has become a risk-off/alternative asset but with Trump fundamentally changing the flow of goods, services and most importantly capital it may be time to discard all the old, known asset correlations aside.
High conviction that Bitcoin heads to at least the 92k - 94k region. Possibility of a surprise run towards previous and perhaps even new ATHs is present and would be confirmed if Bitcoin starts holding the 95 - 96k level.
Ultimately, it is rather likely that the upcoming move is fake/nothing but a bear rally and lower prices are expected or at the very least it is unlikely upside PA for Bitcoin gets sustained in the long term UNTIL
.. as long as Solana is not trading below 80$, chances are we are still in a bear(ish) market.

BTCUSD 4/22/2025Come Tap into the mind of SnipeGoat, as he gives you an update of current Price Action based on his previous analysis & call outs. You've NEVER seen transparency like this. You've NEVER seen Precision like this.
_SnipeGoat_
_TheeCandleReadingGURU_
#PriceAction #MarketStructure #TechnicalAnalysis #Bearish #Bullish #Bitcoin #Crypto #BTCUSD #Forex #NakedChartReader #ZEROindicators #PreciseLevels #ProperTiming #PerfectDirection #ScalpingTrader #IntradayTrader #DayTrader #SwingTrader #PositionalTrader #HighLevelTrader #MambaMentality #GodMode #UltraInstinct #TheeBibleStrategy

BITCOIN open your eyes before believe to 100+++Open your eyes, Bitcoin won’t surge that quickly. A correction might happen down to 70,000 +++
Get your cash ready to grab even bigger gains

What is next move on bitcoin ?I’ve marked out how I’m currently viewing BTC price action. Are we about to see a breakout or a rejection at resistance + my TWT pattern (which I use for pullbacks)?
No position for now — waiting for confirmation. If we get a clean breakout, I’ll be watching for a long on a break & retest. But if we see a strong 4H rejection, I’ll be looking for a short-term trade on the lower timeframes. Let’s see what the market gives us. 👀

BTC 2Day chartPlain and simple here
We clear this level at 88.7k
It’s onward …
Failing ..then more downward action.
Lending more bullish trend.

Market liquidity update April 22nd Short update about where the liquidity is being hedged off by Market Makers.
As of yesterday we have seen much more correlation in the CME futures as CFDs in Europe are being traded less.
Irregular and Time-Layered Liquidity Indicators

(BTC) bitcoin "signs"the blue/green line is crossing the purple dotted line. This is a sign representing a transitional phase between moving averages where the short line begins to cross over the patterns of longer time frames. I was looking at this today and though any indicator is never 100% accurate it is always better to see positive signs rather than no signs at all. Could this be the summer of crypto? A positive crypto summer unlike so many previous years? I'm well aware the second quarter just started and summer is not close by 3 months time.

BTC D1 has not yet reached its peak?BTC D1 has not yet reached its peak.
Currently, the Long peak for BTC is on the D1 timeframe, and D1 continues to confirm upward movement each day. Probing for the D1 peak has not yet confirmed a top.

4/21 - Bitcoin Update on Elliot Waves: Reversal Time?Just dropping this quick update on the Bitcoin analysis before nap time.
See yall next time!

Bitcoin (BTC) Price Projection Based on Previous Halving CyclesHistorical Context:
After each previous halving, Bitcoin has entered a strong bull market, typically peaking 12 to 18 months later:
• 2012 halving → ATH in late 2013
• 2016 halving → ATH in late 2017
• 2020 halving → ATH in late 2021
Assuming the latest halving occurred around April 2024, BTC is now in the early phase of what could be the next major bull run.
Current Technicals:
• Current Price: $87,273.26
• Weekly Change: +2.46%
• The chart shows:
• A breakout above descending resistance (yellow trend lines)
• A potential bullish continuation pattern
• Support around $85,000 holding strong
Projection:
• If Bitcoin follows the same post-halving trajectory, a new all-time high (ATH) could be expected between $120,000 and $150,000 sometime in late 2025 or early 2026.
• The current range between $80,000 and $90,000 may represent a consolidation zone before a major breakout.
• The “Up” signal and positive momentum suggest an ongoing upward move.

Looks like a solid break of downtrend..... I think we go higherThis downtrend has been extremely well respected for past 2 months... Its like its been broken and sustained to the upside....

btc fibonacci levels Btc has hit 88141 level needs to hold 87799 clean close above 88141 green candle buy lock in profits at levels im still looking for 92212 but we will see some volatility when we get into next gann fan around 89934 level

BTCUSD 30M CHART PATTERNThis chart shows a BTC/USD (Bitcoin to US Dollar) trading setup on the 30-minute timeframe. Here's a breakdown of what it's indicating:
1. Pattern Formation: A potential bullish flag or ascending triangle setup is forming after a strong upward move, suggesting continuation.
2. Entry Point: The chart suggests a breakout above the consolidation zone (the horizontal blue line) as a possible buy signal.
3. Take Profit Targets:
First Take Profit: Just above the breakout zone.
Second Take Profit: At a projected target based on the previous bullish move (the "flagpole" height).
4. Stop Loss: Placed below the support zone (highlighted in red), protecting the trade if price breaks down instead.
5. Current Price: Around $87,106, just below the breakout level.
This is a classic risk/reward setup traders use for continuation plays. Do you want help calculating the exact entry, stop loss, and target levels based on this chart?

Trading balanceTrading balance The price of the asset has rebounded from the balance zone. With the prospect of growth into the resistance zone.
BTC RESISTANCESMight have some reaction when the levels got hit. Let's see and review it in the future.
based on just price level and price reactions

uptrendGiven the completion of the corrective pattern and the breakdown of the resistance trend line, we are expected to witness the beginning of the upward trend.

BTC/USD Rallies Above $82,140FenzoFx—Bitcoin has surged past $82,140 resistance and is now trading near $86,800, correcting 1.0% of its recent gains.
The bullish trend persists above the 50-period simple moving average, with immediate support at $86,140 offering a potential entry point for buyers. If this level holds, the uptrend could target $89,000.
Conversely, a dip below $86,140 might push prices toward $84,000 or $82,811.
>>> No Deposit Bonus
>>> %100 Deposit Bonus
>>> Forex Analysis Contest
All at FenzoFx Decentralized Forex Broker

BTC is crossing 87000 crucial levelIf BTC will close above 87000 today, it is high chance to cross 91000 mark.
Note: This is not a buy sell call, trade at your own will, use stop loss.

BTC, THE ONLY ONE THAT WORTH LONGING !Introduction
Crypto Didn’t Make It — Just Admit It
Long positions in crypto are usually pointless and super risky, because crypto simply didn’t make it .
Think of it like the dot-com era—when every company with a website was booming… until they all turned to dust .So there won’t be another altseason.
Crypto had its own version of that in 2021 . Unfortunately, it didn’t deliver anything meaningful to the world. Just sh!tcoin after sh!tcoin.
And let’s be clear: I’m talking about everything except Bitcoin .
The rest? Still pointless. Still super risky. At least until blockchain tech becomes much faster , more advanced, and actually gets used in real, profitable projects that benefit stakeholders — not just hype and tokenomics.
Who am I to say that? Just a trader since 2017 and a blockchain developer (not your average “Web3 dev” who just learned how to deploy a token).
BTC looks primed for a long.
Weekly EMA 55 (orange line) is the key — price above it = bullish, below = bearish. Simple as that.
Right now, BTC is holding strong above it and looks ready to move.
(And yeah, crypto doesn’t care about world news — remember that.)
Entry: ~76,500
Stop Loss: 69,217
Targets:
TP1: 87,196
TP2: 93,985
TP3: 101,900
TP4: 115,534

Bitcoin - Is Bitcoin on the way up?!Bitcoin is above the EMA50 and EMA200 on the four-hour timeframe and has broken out of its descending channel. The continuation of Bitcoin’s upward trend will depend on maintaining the drawn upward trend line.
A valid break of this trend line will cause Bitcoin’s price to correct to the 80,000 range. It should be noted that there is a possibility of heavy fluctuations and shadows due to the movement of whales in the market and compliance with capital management in the cryptocurrency market will be more important. If the downward trend continues, we can buy within the demand range.
Following the announcement of new trade tariffs by the United States, Bitcoin experienced a 16.7% drop in price. However, it partially recovered from its 26.7% plunge. The total global cryptocurrency market capitalization has now reached $2.74 trillion, marking a 1.71% increase compared to the previous day.
Over the past 24 hours, the total crypto market trading volume hit $60.7 billion, reflecting a 32.28% rise. Within this, DeFi transactions account for $5.25 billion, making up 8.65% of the total 24-hour market volume. Meanwhile, stablecoins have dominated trading activity with $55.84 billion in volume, representing 92% of the total market volume for the day.
When comparing Bitcoin’s performance to other major assets, gold leads with a 12.9% gain. In contrast, both silver and the U.S. Dollar Index saw a 4.8% decline. The S&P 500 fell by 13.8%, while the Nasdaq dropped 17.5%. Despite its volatility, Bitcoin sits between oil and the Nasdaq in performance, showing signs of partial recovery. However, its behavior still diverges from that of traditional safe-haven assets like gold.
On the political front, Hong Joon-pyo, a presidential candidate from South Korea’s conservative party, pledged that if elected, he would implement reforms in blockchain and cryptocurrency regulations. He also promised to integrate blockchain technology into public sector and administrative services. Additionally, Hong plans to invest at least 50 trillion Korean won (approximately $35.1 billion) over the next five years in research and development across artificial intelligence, quantum technology, and room-temperature superconductors. These initiatives are part of his broader strategy focused on growth driven by emerging technologies.
In Q1 2025, publicly traded companies collectively acquired 95,431 bitcoins, bringing their total holdings to 688,000 BTC. This amount represents 3.28% of Bitcoin’s fixed supply of 21 million coins.
The Coinbase Premium Index, which tracks the difference in Bitcoin demand between U.S. markets and global exchanges, has shown reduced volatility since March 2024. It appears to be forming a pattern often seen before bullish market trends.
Robert Kiyosaki, renowned entrepreneur and author of the best-selling book Rich Dad Poor Dad, has forecasted that Bitcoin’s price could rise to between $180,000 and $200,000 by the end of 2025. Kiyosaki has long been an outspoken supporter of Bitcoin, portraying it as a safe hedge against inflation and economic instability.

Bitcoin $200k in June 2025Despite the fact that US stocks look bleak, there is no better time for growth than the spring-summer of 2025. By the end of the year, the statistics will start to come out quite sad, and if you do All Time High, then only now. I am waiting for positive news
I estimate the probability of such a scenario at 65%
