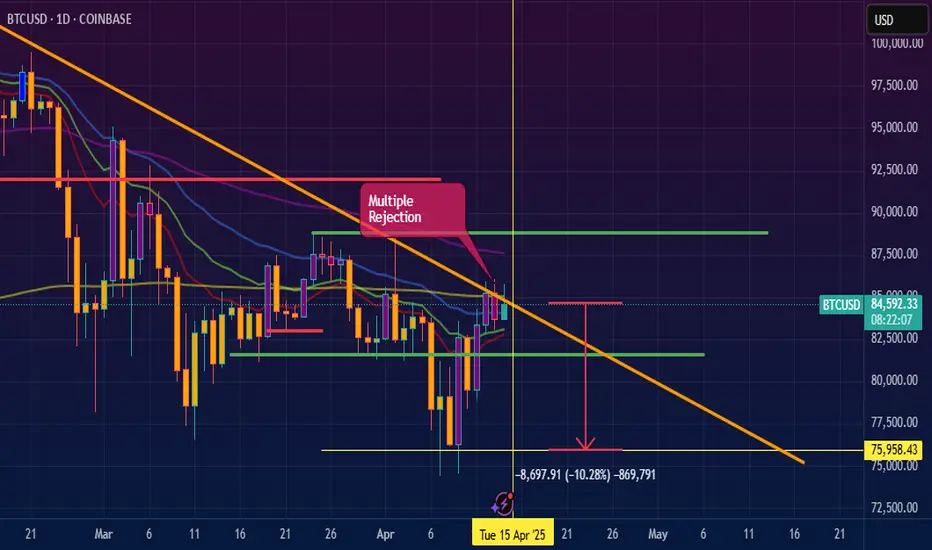
Bitcoin bulls still face medium term diagonal resistance BITSTAMP:BTCUSD has recovered in recent days but still faces a hurdle to the upside as it is pushing up against a descending resistance line, with additional resistance at the $89,000 level.
Using the ForexGPT web app, we can see the following AI-generated analysis using the 4-hour time from on BTC/USD as of April 14th, 2025:
AI-generated analysis for BTC/USD, 4-hour bid prices from January 28, 2025, at UTC 02:52:38
Welcome to ForexGPT! Let's dive into the latest data for BTC/USD on a 4-hour timeframe.
As of the last candle on April 14, 2025:
Price: 84809.2
Open: 84280.4
High: 85038.6
Low: 84157.1
Close: 84809.2
7-period SMA: 84553.9143
14-period SMA: 82656.45
50-period SMA: 81183.452
100-period SMA: 83373.351
Bollinger Bands: Upper: 86400.4939, Middle: 82292.64, Lower: 78184.7861
Donchian Channel: Upper: 85786.4, Middle: 81203.2, Lower: 76620
Sentiment Score: 70.6311
Given the current sentiment score of 70.6311, the market sentiment appears to be quite positive. The price is trading above the 7-period SMA, indicating a short-term bullish trend. The 14-period and 50-period SMAs are also trending upwards, supporting the bullish sentiment. The Bollinger Bands suggest that the price is near the upper band, which could indicate overbought conditions, but also strong upward momentum.
ForexGPT AI-generated Trade Signal
Based on the analysis, I anticipate a long position with the following details:
Entry Price: Market order at 84809.2
Take-Profit Price: 85786.4 (Donchian Upper)
Stop-Loss Level: 83373.351 (100-period SMA)
Risk-Reward Ratio:
Potential Profit: 85786.4 - 84809.2 = 977.2 pips
Potential Loss: 84809.2 - 83373.351 = 1435.849 pips
Risk-Reward Ratio: 977.2 / 1435.849 ≈ 0.68
While the risk-reward ratio is below 1, the strong bullish indicators and positive sentiment may justify the trade. However, always consider your risk tolerance and position sizing carefully.
For further analysis, you might want to explore other timeframes such as 1-hour, daily, or weekly to get a broader perspective on the trend.
Above analysis provided by ForexGPT LLC subject to our terms, and is not investment advice.
BEARUSD trade ideas

bullish for bitcoinBitcoin is about to buy it's now or never up we go without looking at the back, break and retest.

Price Action: Bitcoin BTC Monday 4/14/2025In this video, we are looking into Bitcoins Price Action on Daily Chart throughout the week as it approaches previous levels of resistance on its move towards 85k -88k mark.

Bitcoin Double Top Signals Caution: Key Support Zones to WatchCRYPTOCAP:BTC previously formed a strong double bottom around the $74,500 level, which led to a bullish rally pushing the price up to a saturation zone near $86,000. However, current price action suggests a double top formation — a classic bearish reversal pattern. This aligns with RSI trendline rejection and signs of bearish divergence, reinforcing the bearish sentiment.
The key question: Is this a correction or the start of a deeper dump?
If BTC holds above $79,000, it may just be a healthy correction.
A breakdown below $79,000 brings the next support near $76,000 into focus.
If that fails, Bitcoin could revisit the $69,000 zone, which aligns with earlier consolidation.
Traders should monitor RSI closely and watch for reaction at the support zones. Opportunities exist for both short-term scalps and long-term positions near key levels.

BITCOIN MAPPING 2025This report provides a comprehensive analysis of Bitcoin (BTC), focusing on recent price movements, trading volume, market sentiment, and key technical indicators. It examines short-term and long-term trends, identifies support and resistance levels, and evaluates potential breakout or correction scenarios. The analysis also considers macroeconomic factors and developments in the broader cryptocurrency market that may impact Bitcoin’s performance.

BTC Still in Downtrend – Watch for Breakdown Below 82.7k📌 Structure & Price Pattern
- Still forming lower highs & lower lows.
- Signs of a potential reversal are appearing, but the overall structure remains bearish.
- Based on Elliott Wave count, it may still be completing a major 5th wave down.
- As long as the upper trendline holds, downside pressure remains.
📈 Technical Indications
- Bearish momentum still dominant despite a Bullish Divergence on the Daily timeframe.
- Weekly timeframe shows price is struggling near resistance areas, although still above EMA.
- On M30, price remains under pressure even if it's hovering near EMA.
⏰ Key Timing
- Peak reversal expected around *April 15* (Monday–Tuesday), potential swing high ➜ correction ➜ sideways ➜ continuation down.
📍 Key Levels
- 🔽 Bearish Confirmation: If price breaks below *82,700*, expect further downside towards:
- 🎯 Target 1: 79,000
- 🎯 Target 2 (final): 76,000
🚀 Focus:
• Reversal expected on April 15
• Break below 82.7k = short-term sell
• Downtrend remains intact unless major structure breaks
btcusd on bearis reverse above 86170#BTCUSD on bearish above 86170, price needs to move above there before sell reverse will occur.
Above 86170 holds bearish reverse which will drop the coin below 84264, stop loss at 87300.
No possible bullish yet, unless the third pattern is broken.

Ahmed NagarAhmad Nagar Trading is a trusted stock market investment company committed to empowering individuals and businesses with smart, strategic, and secure financial growth opportunities. Based on deep market insights, advanced analytics, and personalized investment strategies, we help our clients navigate the complexities of the stock market with confidence.
With a team of experienced traders and financial advisors, Ahmad Nagar Trading offers a wide range of services, including portfolio management, equity investments, trading consultation, risk assessment, and long-term wealth planning. Whether you're a beginner or a seasoned investor, we tailor our solutions to suit your goals and risk appetite.
At Ahmad Nagar Trading, our mission is to build financial freedom and trust—one investment at a time.

bitcoin dips below 60kbitcoin dips below 60k, but we're unfazed.
i see this playing out as we move into the depths of winter,,,
this crypto winter ❄️
why would this happen, you ask?
the answer is simple: a stop-loss raid.
a sharp wave 4 designed to shake out weak hands.
distribution may have already started, hypothetically speaking, but it'll take the rest of the year to unfold.
think of it like the jan 2021 -> april 2021 vibe, only on a slightly higher degree and timeframe.
---
take note of the highlighted wave 2's and wave 4's on my chart.
what i'm illustrating is "the law of alternation," which states:
if wave 2 is flat, wave 4 will be sharp, and vice versa.
all the wave 2's in this cycle have been flats,
so by design, all of our wave 4's are set to be sharps.
this fits neatly into the larger cycle:
sharp retracements triggered by over-leveraged positions,
yet consistently bought up thanks to strong demand.
with each sharp retracement, however, the upward moves become smaller,
as momentum gradually fades.
---
w4 target: below 60k
w5 target: between 150k-200k (conservatively).
---
ps. i have recently shared a much more bullish idea via:

BTC to likely kiss the $74K - $69KBitcoin Market Analysis and Forecast
Bitcoin has retraced over 50% from its all-time high (ATH). Despite a rebound from the Fibonacci 50% level to its current price of $84,600, continued selling pressure could push BTC lower toward the Fibonacci 61.8% retracement zone, which lies between $74,000 and $69,000.
This potential pullback presents strategic entry points for long-term investors who have the patience to hold through market cycles.
Given the current market conditions, I will continue to accumulate using a Dollar-Cost Averaging (DCA) strategy to mitigate volatility and optimize long-term gains.
I will be monitoring the price action closely and providing further updates as the market develops.

BITCOIN NEXT MOVES!Bitcoin’s Next Move
In the long run, it's clear—Bitcoin is the new digital gold. Any dip at this stage is a potential opportunity. With over 7 years of experience in Bitcoin analysis, I believe in the bigger picture and long-term value.
If you'd like me to analyze or give insights on any other coin, feel free to ask. And don’t forget to follow for more crypto updates and analysis!

BTC/USD @84,700 sell 4h chart analysistrade plan looks when interpreted as key support and resistance levels on the chart:
Resistance (SL): 86.500 — Strong resistance zone, price invalidation point
Entry Level: 84.700 — Near a potential resistance-turned-entry zone
Support 1 (TP1): 80.000 — First major support, possible bounce zone
Support 2 (Final TP): 75.000 — Longer-term support, possible reversal or consolidation area
This setup suggests you're expecting the market to respect 83.500 as a lower high or a failed rally, aiming for continuation to the downside. Watch for:
Bearish confirmation candles around 83.500
Momentum indicators showing divergence or downtrend strength
Price rejection or volume spikes near resistance
If you’re on a higher time frame (like H4 or Daily), this could be a strong swing trade setup. Want help drawing this up visually or adding confluence zones like Fibonacci or moving averages?

BTCUSD Downside - Is Yesterday the swing high?Yesterday closed bearish, and there is a trendline break pattern suggesting a bears to enter the market.
Watching the recent two days low, if we can make a break below 83K then it should be clear sailing to the 80K mark.
Alternatively, a break above yesterdays high would signal further buying.
Watch this space!

Short on BTCUSDBitcoin (BTC/USD) – Bearish Outlook Amid Economic Uncertainty
We anticipate a short-term bearish trend for BTC/USD, driven by escalating economic concerns and the recent resurgence of trade tensions. The imposition of new tariffs has negatively impacted market sentiment, contributing to downward pressure on Bitcoin. The current price structure also suggests limited bullish momentum, favoring another potential sell-off.
From a technical perspective, forming a Bearish Butterfly Harmonic pattern further supports the expectation of a downward move.
Trade Setup:
Entry Level: 84,500
Take Profit 1: 78,500
Take Profit 2: 74,500
We recommend monitoring macroeconomic developments closely, as further deterioration could accelerate the bearish trend.


Macro resistance became support BTCUSD 4hBTC 4h broke through the long term resistance. Has already retested and is currently on the way up. This line is now support.
Will it break through the second long term support line which became resistance or will we go down again? Time will tell.

BTC - Has the market stopped falling?Ive been looking for a bottom at FWB:73K -72k for some time. We saw $74,400 and I'm not sure that was THE low. And now we have begun what looks like a false break out. The price is good, but the wave structure is all wrong. In this would be strong counter wave rally we could see prices to around $98,400. Its time to close the shorts, and open the longs but stay very vigilant as this is not another bull leg that leads to a new high. ( In my opinion) It is a decent opportunity to make some money on the long side, but at the end of this rally, I would be opening shorts again. Ill keep posting as developments occur. Prices above $87,600 are very bullish.

BTCUSD 4/13/2025Come Tap into the mind of SnipeGoat, as he gives you an outstanding update to his previous Analysis. Showing that Price did in fact do exactly what he said it was about to do. But this next Analysis is a Jaw Dropper! Tune in to find out this MEGA MOVE that Price is gearing up for.
_SnipeGoat_
_TheeCandleReadingGURU_
#PriceAction #MarketStructure #TechnicalAnalysis #Bearish #Bullish #Bitcoin #Crypto #BTCUSD #Forex #NakedChartReader #ZEROindicators #PreciseLevels #ProperTiming #PerfectDirection #ScalpingTrader #IntradayTrader #DayTrader #SwingTrader #PositionalTrader #HighLevelTrader #MambaMentality #GodMode #UltraInstinct #TheeBibleStrategy

Bitcoin Testing the Gaussian Midline – Bounce or Starts Reversal🟡 Weekly Macro View – Gaussian Channel Holds the Truth
The Gaussian Channel on the weekly chart is painting a high-risk environment:
* Price is hovering below the Gaussian midline, which is currently acting as dynamic resistance at ~$84K.
* A red Gaussian channel is flashing caution — these phases typically indicate distribution or early-stage downtrends.
* BTC previously lost the mean and retested the lower channel, bouncing aggressively off the ~ FWB:73K region — this bounce is the first sign of life, but it’s not confirmation of a trend reversal yet.
What to watch this week:
* If BTC can reclaim the Gaussian mean and close above ~$85K with strong volume, we may see a macro reversal pattern forming.
* However, another rejection from the midline would point to a slow bleed down toward FWB:73K and possibly the lower channel edge near $63K–$65K.
🧭 Weekly Bias:
Cautiously Bearish — Price is below the Gaussian midline in a red channel. Reclaiming $85K flips the tone.
⚠️ Daily Chart View – Bearish Control, Weak Bounce
The daily chart confirms short-term bearish pressure is still intact:
* BTC remains within a down-sloping channel and is struggling to break through key lower highs.
* Volume footprint shows no major demand spike — each bounce is getting sold into.
* The trendlines drawn from recent highs form a clear wedge; price is compressing, signaling a big move is coming.
Support/Resistance Zones:
* ⚔️ Resistance: $84K–$85K
* 🛡️ Support: $80K > $73.6K major zone > $69.9K panic support
* 📉 If we lose $80K again, a retest of $73.6K is very likely.
* 📈 If bulls push above $85K, BTC could rally quickly toward $92K.
What to look for this week:
* A daily close above the upper trendline of the channel on rising volume = first bullish signal.
* A daily lower high + lower low continuation below $80K confirms bears still in charge.
🧠 Final Thoughts – Strategy This Week
BTC is caught in a macro correction but trying to build a base. The Gaussian Channel on the weekly says we're in a danger zone, but the daily shows traders testing the bears’ strength.
🧩 My read:
* Swing traders: Wait for daily close above $85K before going heavy long.
* Scalp traders: Monitor $80K– GETTEX:82K for bounce-to-fade plays.
* HODLers: Prepare for longer consolidation — weekly Gaussian phases take time to resolve.
🧠 This is a "watch, not chase" environment. Let the breakout confirm — not predict.

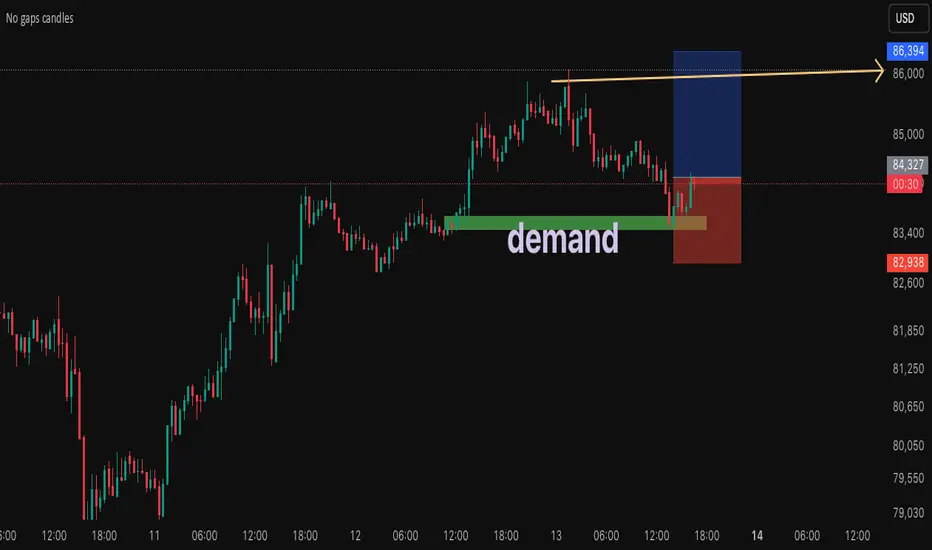
SHORT TERM Bullish set up on Btc usd Liquidity area.
.we'll experience a liquidity grab pretty soon and then,we'll take off to the up side.. take profit at 86,-000

BTC Just a lil fun here with the last two impulses we had so far from breaking ATHs to 109K.. would put us at the end of May or beginning of June. around 140k.

What to expect from the markets this weekWith markets taking a break from the US and China going off on each other for 5 days straight, investors are bracing for a potentially turbulent week ahead.
Cryptocurrencies seem to have recovered a large chunk of their losses from the first week of April, but how long can we expect this upward reversal to last?
Well, if we're being realistic, not long . If you take a look at the price charts of most cryptocurrencies, you'll notice a common theme: we're in a mid- to long-term downtrend.
If you've been trading cryptocurrencies (or any other type of security) for a while, you're probably familiar with the saying that goes “ The trend is your friend ”. With that in mind, if you're looking to hold any short-term crypto trades, shorts might offer better, less-risky opportunities.
Now's not the time to panic and FOMO into the market. Big players are still looking to shake weak hands out of the market. My advice: Observe market fluctuations through the first days of the week before committing your money to any trade.
