BTC SHORT TP:82,300 17-04-2025🚨 Time to go Short! The targets are set between 82,000 and 82,500, with the 4-hour and 8-hour timeframes indicating a bearish trend.
We anticipate this downward movement to unfold within the next 2 days. It’s crucial to enter at the right moment and consider averaging down to maximize your potential gains.
Keep an eye on market updates to adjust your strategy accordingly. Following me will ensure you stay informed about any changes and the latest insights. Let’s navigate this market together and aim for those profits! 📉💰
BEARUSD trade ideas

Bitcoin - All Time Highs Are Inevitable!Bitcoin ( CRYPTO:BTCUSD ) is still massively bullish:
Click chart above to see the detailed analysis👆🏻
Despite the correction of about -30% which we have been seeing lately, Bitcoin remains in a bullish market. Even if we see another drop of about -20%, this will still just turn into a textbook bullish break and retest and either way, new all time highs will follow on Bitcoin.
Levels to watch: $70.000, $400.000
Keep your long term vision,
Philip (BasicTrading)

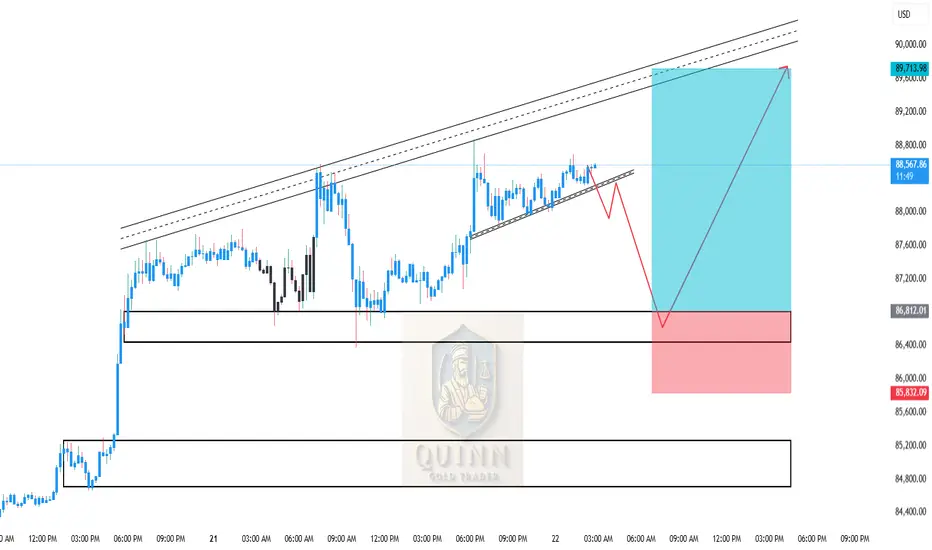
BTCUSD Intraday Move 22-04-2025📊 BTCUSD Analysis – April 22, 2025
Price action is currently forming a rising wedge, typically a bearish pattern, indicating that a short-term correction may occur before the next bullish impulse. The structure shows consolidation with weakening momentum, suggesting that a pullback to demand zones is likely.
We have two strong support zones identified:
Zone 1: 86,400 – 86,800 — minor support from recent consolidation.
Zone 2: 84,700 – 85,100 — major demand area aligned with previous breakout and price reaction.
A retracement into either of these zones offers high-probability buy opportunities for continuation toward the upper resistance trendline and prior high near 89,700.
📈 BTCUSD Buy Signal:
Buy Entry #1: 86,400 – 86,800
Buy Entry #2: 84,700 – 85,100
Take Profit: 89,700
Stop Loss:
For Entry 1: Below 86,200
For Entry 2: Below 84,500
Trade Idea: Wait for bullish price action (engulfing candle, pin bar, or volume spike) before entering.
bitcoin sell or shortliquidity down below
bullish shorterm exhaustion
use proper risk management
#forex
#bitcoin
#weekend
#crypto
#coins

BITCOIN (BTC) Trading Plan.Bitcoin (BTC) Trading Plan:
Resistance Level: $88,000
Support/Channel Level: $85,000
Target Levels:
If price rejects $88,000 and breaks below $85,000,
Sell target: $78,000
If price holds above $85,000 and breaks out above $88,000,
Buy target: $93,000

$BTC: We Are in a Bear Market Until Proven Otherwise🚨 CRYPTOCAP:BTC : We Are in a Bear Market Until Proven Otherwise 🚨
📌 Follow-up to my December 2024 post:
🔗
Despite record-breaking bullish news, Bitcoin is not at an all-time high. Why? Because we’re still in a bear market—until the charts say otherwise.
✅ Bullish Factors:
Michael Saylor continues buying billions
President Trump & family pushing crypto/meme coins
Rumors: Fed buying CRYPTOCAP:BTC with gold?
Trump pinned the Bitcoin white paper at the White House
U.S. banks fully onboard with crypto
ETFs accumulating CRYPTOCAP:BTC
National crypto reserve announced
❌ Bearish Signals:
Fear & Greed Index in "extreme fear" for 30+ days
Price is below the EMA50 on weekly
Monthly MACD nearing bearish crossover
Trading volume decreasing
Crypto search interest at multi-year lows
Retails not buying — this is all institutions
Powell confirmed we're in a recession
Desperate whales calling for $5M–$9M BTC to bait retail
🧭 Monthly chart check the MACD:
🔗
⚠️ Key Insight:
Every cycle, people confuse a relief rally for a new bull run. This isn't new.
A relief rally = short-term price recovery in a bear market.
(AKA a dead cat bounce or sucker rally)
📊 Past relief rallies (check the chart):
+45% (Feb 2022)
+32% (June 2022)
Current one: only +16% — still within bear territory.
📉 Price could hit $91k and still drop lower while staying in an ongoing bear Market..
🧨 Bear Market Target: GETTEX:25K – FWB:27K
📈 Invalidation? Only if we close above $101K
Don’t trade your emotions. Trade the charts. They never lie.
#Bitcoin #CryptoMarket #BTC #BearMarket #CryptoAnalysis #SPX500 #CryptoTrading #Recession2025 #BTCPrice #CryptoCrash #CryptoNews #MichaelSaylor #TrumpCrypto #BTCBearMarket

BRIEFING Week #16 : ObservationHere's your weekly update ! Brought to you each weekend with years of track-record history..
Don't forget to hit the like/follow button if you feel like this post deserves it ;)
That's the best way to support me and help pushing this content to other users.
Kindly,
Phil

BTC/USDSomething like this makes the most sense from manipulation perspective.
I'm sure much was learned from the 2020 crash.
Say you build a shelf for your garage, hindsight says could've used screws instead of nails here and should've clamped there, wood glue, different joint style, etc etc etc... but the finished product won't look significantly different or have any change in functionality.
Sharp dive somewhere in the 40k region is my guess.

CHECK BTCUSD ANALYSIS SIGNAL UPDATE > GO AND READ THE CAPTAINBaddy dears friends 👋🏼
(BTCUSD) trading signals technical analysis satup👇🏼
I think now (BTCUSD) ready for(BUY)trade ( BTCUSD) BUY zone
( TRADE SATUP) 👇🏼
ENTRY POINT (86900) to (86800) 📊
FIRST TP (86470)📊
2ND TARGET (85940)📊
LAST TARGET (85500) 📊
STOP LOOS (87500)❌
Tachincal analysis satup
Fallow risk management

Bitcoin Monitoring- This is not a trade setup.
--------------------------------------------
- Zones to keep close surveillance :
--------------------------------------------
- 25,200$
- 27,300$
--------------------------------------------
Happy Tr4Ding!

I think BTC is forming and inverse head and shouldersI believe that BTC is going to test the resistance once more with some buying pressure. Then reject it and create a higher low while also touching the support to breakout above the resistance level and create higher highs. Price is also testing the 50MA from below on the Daily chart and is quite stagnant but I believe that is just building explosive pressure to breakout upward or at least establish a new high to keep that slight uptrend in motion. On the weekly chart we are pretty bullish as well. Price seems to be trying to use the 50MA as support hopefully propel itself upward. My sentiment currently for BTC is BULLISH.🐂

BTC Diamond Ser ?- While bears see bearish pennants, I see diamonds in the rough.
- I remain bullish, not due to the price, but for the sake of humanity.
- This isn’t an analysis, just a light-hearted joke, so please don’t roast me too hard! 🙏.
- Remember, diamonds are forever.
- Hodl!
Happy Tr4Ding!

Bitcoin investmentBitcoin has just respected a flip zone on the weekly timeframe(resistance turned support) and price has went ahead to break the daily trendline which still signals bullish momentum however we awaits the close of the weekly candle for a more precise decision and confirmation.

BITCOIN (BTCUSD): Waiting For BreakoutIt appears that ⚠️BITCOIN is getting ready for a potential upward movement.
Upon analyzing the daily chart, I spotted a falling wedge pattern and a confirmed breakout above its upper boundary.
The final hurdle for buyers is the resistance level between 8,7478 and 88799 on a daily chart.
If the bulls are able to surpass and close above this level, it will be a significant bullish signal.
This could lead to a continuation of the bullish trend, possibly reaching the next resistance level.

BITCOIN - Bullish Double BottomHello Traders !
The BTC price formed a double bottom pattern.
Currently, The neckline is broken !
So, I expect a bullish move🚀
______________
TARGET: 88700🎯

BTC/USD - The Bitcoin Cycle TopBTC has recently broken below a key uptrend line that had been guiding price for some time. I’m watching for a potential backtest of that broken trendline, a rather classic move that could set the stage for a final upwards squeeze, possibly printing a quick higher high to trap late longs.
I’m watching the circled area closely as a potential exhaustion zone. Key levels and price action around the trendline will be critical, breaking of upwards trendlines after backtesting may mark the beginning of the larger unwind.
We could see multiple backtests of the broken trendline over time, with the trendline now likely acting as resistance.
Note: I’m publishing this idea simply to have a timestamped record. This post is my way of putting a clear marker in the sand. I’m not looking to debate or go deeper into the reasoning, and I generally won’t be responding to comments.

(BTC/USD)1H Chart Analysis –Bullish Breakout Setup Toward 98,000Technical Breakdown:
🔹 EMA 9
📉 Orange line (EMA 9 close): $93,233.68
➡️ Price is above EMA, showing bullish strength.
📦 RBR Zone (Rally-Base-Rally)
🔵 Zone: ~$92,000 - $93,000
🛡️ Acts as a support area — price could bounce here if it dips.
🚧 Resistance Zone
📍 Just above current price
📈 A breakout above this zone may trigger a bullish run.
🎯 Target Point: $98,000
🚀 Potential gain: +7.09%
📊 Strong upside target if breakout holds.
🛑 Stop Loss: $90,314.13
⚠️ Placed just below the RBR zone to minimize risk.
Trade Idea Summary:
🔽 Entry: On breakout above resistance
🎯 Target: $98,000
🛑 Stop Loss: $90,314.13
📈 R:R Ratio looks favorable

Big Retest for BTC BTC is currently retesting the area is made the first big break from.
If we reject from here, it's usually pretty easy to map out the next important levels, since we generally trade down to the 2.20 fib of the failed rally. Around 40,000 in this instance.
This is a real make or break point for BTC. If we see a rejection here, then there's a strong chance this is a change in the overall prevailing trend and start of a long drawn out bear trend.
Conversely, if we can rally through, then things look far more optimistic.
But this would be the obvious risk spot for bulls and the high value betting area for bears.
Strong odds an important decision is made here.


CHECK BTCUSD ANALYSIS SIGNAL UPDATE > GO AND READ THE CAPTAINEntry Zone: Around 94,000 (current price: 93,928)✅
Stop Loss: 94,400❌
Take Profit 1: 93,600✅
Take Profit 2: 93,200✅
Last Target: 92,900✅

BTC short BTC/USD is testing the upper boundary of a rising channel near $88,000. Price action shows a potential rejection from previous resistance. Bearish scenario highlighted with a possible move back toward the lower trendline zone near $70,000. Volume remains steady. Watch for confirmation.

Is this the perfect time to buy Bitcoin? Hello,
While the significant market correction since January 2025 has left many feeling fearful, we believe this presents a perfect opportunity for those with a long-term investment horizon. The recent pullback in asset prices, particularly in the cryptocurrency space and equities, has created an attractive entry point for seasoned investors.
President Trump's ongoing commitment to positioning the United States as the global capital for cryptocurrency, with Bitcoin as a key component of the nation's reserves, reinforces the enduring fundamental strength of this digital asset. Despite the short-term volatility, Bitcoin's long-term prospects remain robust, supported by this high-level governmental endorsement .
Since its peak in January, Bitcoin has experienced a correction exceeding 25%, bringing it to levels that we view as an ideal accumulation zone. Our technical analysis further confirms this perspective, as the cryptocurrency approaches a critical upward trendline, suggesting that buyers may soon step in to drive a resurgence. Additionally, the MACD indicator is on the cusp of a bullish zero crossover, providing additional confirmation of an impending rebound.
For patient, forward-thinking investors, we strongly recommend initiating or increasing Bitcoin positions at these current prices. By adopting a disciplined, long-term approach and weathering the near-term fluctuations, you can position yourself to capitalize on the substantial upside potential as Bitcoin's trajectory aligns with the supportive stance of the U.S. government.
Disclosure: I am part of Trade Nation's Influencer program and receive a monthly fee for using their TradingView charts in my analysis.

BTC/USD Eyes $109K After Bullish Breakout!!🧠 Chart Type and Indicators:
Chart Type: Candlestick
Indicators Used:
EMA 50 (red line): 85,335.18
EMA 200 (blue line): 85,657.29
🔍 Technical Pattern Analysis:
Pattern Identified: Ascending Triangle
The price has formed higher lows (ascending trendline support) while repeatedly testing a horizontal resistance zone (~$88,000), forming an ascending triangle.
This is typically a bullish continuation pattern when it occurs after an uptrend, though in this context, it's forming after a consolidation, giving more significance to the breakout.
🚀 Breakout Confirmation:
The price has broken above the horizontal resistance and is currently trading at $92,766.51.
Volume is not visible but should be increasing during a valid breakout.
Both EMAs have been decisively breached to the upside, signaling momentum shift in favor of bulls.
🧩 Key Levels:
Support Zone (Post-Breakout Retest): ~$88,000
Previously a resistance zone, now likely to act as support.
Immediate Resistance: ~$96,000
Historical resistance zone shown on the chart with a horizontal black line.
Extended Target (measured move): ~$109,420
Based on the height of the triangle projected from the breakout point.
📈 Price Action Forecast:
Two possible scenarios (depicted with arrows on the chart):
Bullish Continuation:
A retest of the $88,000 zone followed by continuation to $96,000, then $109,420.
Short-Term Pullback:
Price may dip to retest the breakout zone (~$88,000), consolidate, then rally higher.
✅ Bullish Signals Summary:
Breakout from a bullish ascending triangle.
EMAs crossed and price holding above them.
Clear higher highs and higher lows formation.
Momentum suggesting further upside.
🧨 Risks to Watch:
False Breakout Risk: If the price fails to hold above $88,000 and falls back into the triangle range.
Macro Factors: Bitcoin remains sensitive to macroeconomic news and regulations that could disrupt technical setups.
