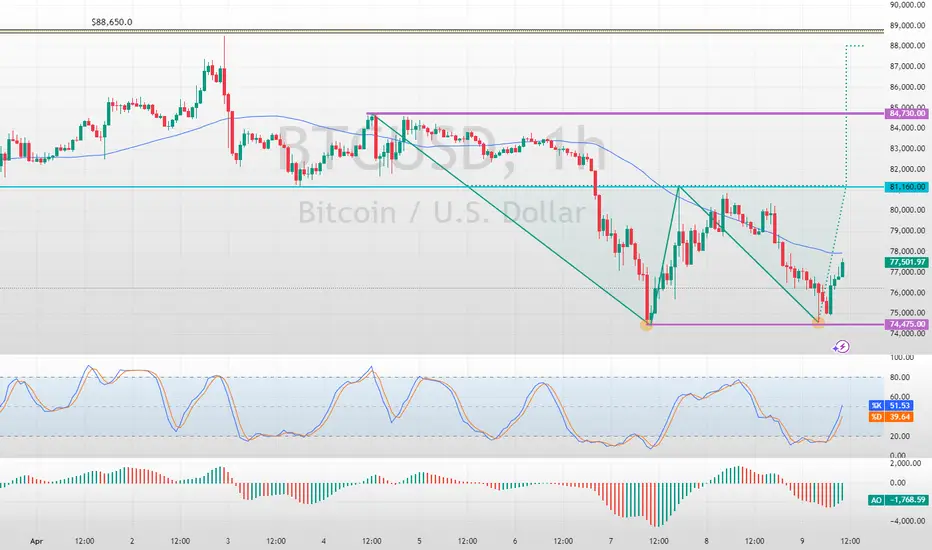
BEARISH RETRACEMENT for a BULLISH CONTINUATION? Thick long blue Line 1.618 TP level
Thick RED long Line 2.618 fib level
But btc has (as you can see on small green horizontal lines) Already hit a ( Perfect ) Fib retrace level of .786 ( Thicker line is perfect retracement from the highest point before the low) , the thinner green line is the later "high" shortly after it.
THUS ==> I think retracement is now in the make, for how much? I dont know, we can count on 0.5 to .618 move I think , before it continues bullish momentum.
OFCOURSE, its BRYPTO, its BITCOIN, it may also fall the hell back down again. Maybe to around the 76k level! But I THINK the first will play out!
So keep the other scenarios in mind as well.
I expect you can be calmly expecting a further bullish momentum , not taking news into consideration , but i think "A lot of bears have been SHOT on the way"! - Thus, having seen A LOT of BEARISH movements, It may be finally time to become BULLISH again, and CONTINUE!! :rocket:
BEARUSD trade ideas
BTCUSD:You need to refer to this strategyPresident Trump of the United States suddenly announced the suspension of tariffs, which led to a significant change in market sentiment.
Since tariffs play a crucial role in global economic relations and market expectations, this unexpected move has caused investors to adjust their investment portfolios.
As the new tariff suspension policy has reduced market uncertainties to a certain extent, gold, which is usually regarded as a safe-haven asset, has been sold off.
Conversely, the price of BTC has soared, reflecting the market's rapid response to this major policy change.
If you're at a loss right now, don't face it alone. Please get in touch with me. We are always ready to fight side by side with you.

The Daily Income Maker ~ Investment ChartUse The Daily Income Maker ~ Investment Chart to plan investment trades, predict markets by means of the investment chart analysis, and do trades, both buy and sell automatically.

The Daily Income Maker Investment ChartThis provides an investment chart for long term prediction and anlyis of investments. It implements the trades based on signals.

Fade The News You have to fade the news because it's all technical. As you can see we have a strong hidden divergence on the 1hr TF. The bears did not succeed in trying to wipe out the low of 74,483. Instead price found it's ground at 74,588. The news articles/billionaires who control the news are trying to convince traders to sell but HODL or you will regret the biggest profit potential in history.

Bullish setup for Bitcoin for coming 6 monthsIf we look at pure technicals. Basic technicals, things couldn't be more bullish. The sentiment is at extreme fear, but look at this beautiful chart.
Maybe we chop here for a bit, but once the MACD flips in momentum weakness, then I suspect massive upwards move for Bitcoin.

CHECK BTCUSD ANALYSIS SIGNAL UPDATE > GO AND READ THE CAPTAINTrade Type: Long (Buy)
Entry Zone:
Around $76,100, as indicated by the horizontal entry box (blue zone).
Take Profit Levels:
1. TP1: Around $77,000
2. TP2: Slightly above $77,000 (approx. $77,400
3. Last Target: $77,900
Stop Loss
Placed at $75,300
FALLOW RISK MANAGEMENT ✅

possible market next movesI been trading for 4 years now , i work with my the best trading plan
to known the next best possible market moves,

BTC, 73K Based on technicals, BTC seems to be heading for 73k, which it never really retested after it broke through and this is a key level based on previous PA. I believe we bounce from 73k but then again, considering other macroeconomic factors, things could be different.

BTC Double Tops Trap or Trump BreakoutAs noted on the charts BTC has reached a critical point in its journey. Altcoins are already hammered into the weekend, is this an early indication of a rug pull?
BTC on the 8H time frame is showing rejection of higher prices into previous all time high with most indicators sounding a warning. I am only sharing my thoughts on whether this is a market maker's trap or Trump Breakout Trade.
Personally, I have a bias that even if US congress and White house would designate BTC as a Reserve asset (That's a Big iF), my question is would the US government with it's mountain of debt and DOGE (Department of Government Efficiency) buy BTC at over $100,000 per coin? Where is the taxpayer money to accumulate BTC at this price. I suspect the insiders will pull the rug before such an event.
Let the chart print!!!
These are just my thoughts I am sharing with the world. Cheers to profitable trades!

2024-? Deathcross Goldencross Pattern for BTCDeathcross then Goldencross then Deathcross creating a zone indicates a bearish move.
The time to sell before bigger dump ahead
Goldencross then Deathcross then Goldencross creating a zone indicates a bullish move.
The time to buy before bigger pump ahead

2021-2024 Deathcross Goldencross Pattern for BTCDeathcross then Goldencross then Deathcross creating a zone indicates a bearish move.
The time to sell before bigger dump ahead
Goldencross then Deathcross then Goldencross creating a zone indicates a bullish move.
The time to buy before bigger pump ahead

2017-2021 Deathcross Goldencross Pattern for BTCDeathcross then Goldencross then Deathcross creating a zone indicates a bearish move.
The time to sell before bigger dump ahead
Goldencross then Deathcross then Goldencross creating a zone indicates a bullish move.
The time to buy before bigger pump ahead

2012-2017 Deathcross Goldencross Pattern for BTC Deathcross then Goldencross then Deathcross creating a zone indicates a bearish move.
The time to sell before bigger dump ahead
Goldencross then Deathcross then Goldencross creating a zone indicates a bullish move.
The time to buy before bigger pump ahead

BTC/USD Long Setup – Bounce from Demand Zone Towards $80K TargetKey Zones
Demand Zone (Buy Zone)
🔵 $74,250 – $75,000
Strong support area
Buyers previously stepped in here
Marked for potential entry
Resistance Zone
🟣 $77,300 – $77,600
Mid-level resistance
Could cause a short pullback
Watch for breakout or rejection
Target Point
🎯 $80,273.49
Potential upside: +6.68% gain
Previous supply/structure zone
Take Profit (TP) zone
Stop Loss
⛔ $74,247.07
Just below the demand zone
Protects against invalid setup
Trade Idea
1. 🔽 Price expected to drop into demand zone
2. 🔄 Wait for bullish confirmation (e.g. bounce or engulfing candle)
3. 📈 Enter long position near $75,000
4. ⬆️ Ride it up through resistance
5. ✅ Target = $80,273 | ❌ Stop = $74,247

BTC at a Critical Inflection Point – Bulls vs. BearsBitcoin is currently trading around $77,644, sitting right between two major trendlines:
🟢 Long-Term Bullish Support – This green ascending trendline has held since late 2023, providing key support throughout BTC’s macro uptrend.
🔴 Medium-Term Bearish Resistance – The red descending trendline has capped price since the 2025 highs, forming a clear structure of lower highs.
We're now at a pivotal confluence zone where these two trendlines intersect. Price recently bounced off the green support, but it's struggling to decisively break above the red resistance.
🔍 Key Scenarios:
✅ Bullish Breakout:
A strong daily close above the red trendline could confirm bullish continuation.
Targets: $84K, GETTEX:92K , and potentially ATH breakout above $100K.
❌ Bearish Rejection:
Rejection at resistance may lead to a retest of the green trendline (~$74K).
A breakdown from there opens the door to GETTEX:64K –$60K, or even deeper pullbacks.

BTC/USD 1H Chart Analysis – Bearish Setup with SBR Rejection🔵 Key Zones & Levels:
🔷 SBR Zone (Support ➡ Resistance):
Price Range: ~$81,000–$83,000
🛑 Stop Loss: $83,002.31 (Just above resistance)
Expecting sellers to step in here if price retests this level
🟠 Mid-Range Zone:
Current price is consolidating just below SBR zone
Could form a lower high before dropping
🟦 Target Zone (Support Area):
🎯 Target Price: ~$75,000
Previous demand area – price bounced hard from here before
🔁 Trade Plan:
📉 Bias: Bearish
📍 Entry: Near current price or after retest of SBR zone
🛑 Stop Loss: $83,002.31
🎯 Target: $75,000 (approx -8.33%)
✅ Summary:
Risk-Reward: Appears solid (R:R > 2:1)
🕵️♂️ Watch for: Fakeouts or rejections in the SBR zone
🔻 Potential Move: -6,804 points if plan plays out

Bitcoin Formed a Double Bottom Bullish PatternFenzoFx—Bitcoin formed a double bottom bullish pattern. A consolidation phase toward $81,160 is imminent if the price holds above $74,475.
>>> Trade BTC/USD, swap free at FenzoFx Decentralized Forex Broker.
BTCUSD 1H Outlook – Anticipating Liquidity Sweep & ReversalPrice is currently reacting at minor resistance, but the structure suggests a potential liquidity grab below the recent lows. If price taps into the 74K demand zone, I’ll be watching for bullish confirmation targeting the 84K region.
📌 Key Levels:
Demand: 74,000
Resistance: 84,000
Watching for: Sweep > Rejection > Break of structure
Patience here is key. Waiting for price to show its hand before executing.

Bitcoin and 50 SMA on a WEEKLY chart - UPDATE Following on from the sharp drop in the beginning of the week, where PA dropped Below the 50 SMA ( RED) , PA has recovered and, as you can see, the candle Body is currently sitting ON the 50 SMA
We may need to remain in this area to bring back the Bullish Sentiment and then move higher.
It can be said that a bullish sentiment remains with Bitcoin as its did NOT crash as sharply as Stock Markets.
We are also now waiting on the MACD to fully enter the "Bounce Zone"
The Weeks candle on the histogram has returned to RED and so some caution is required here, while we wait.
It is the next few days that are crucial now. The "Tariff" dust us settling and countries are reacting to Trumps Tariff impositions.
My Gut feeling is VERY positive right now.
But that is just me,
Watch that candle on the 50 SMA like a Hawk. If we loose that again and the week closes below, THEN we need to think carefully

check the trend It is expected that a trend change will form in the current resistance range and a corrective trend will form. By passing the resistance range, the upward trend will likely continue.

BTC heading to 59k levels, then 50kThere is no macro narrative nor equity flows to support any story of CRYPTOCAP:BTC bouncing back north. It will hit the next support levels at 100week and 200week SMA, which also correspond to the bottom of this bullish long term channel.
There needs to be a positive macro narrative to facilitate the volumes needed to make the price movement trend north but I see indication of that in US or European markets for the foreseeable future.

The Big drop is coming This is just my idea I'm hoping Bitcoin will fall to 72000 if it does I'm thinking it going to keep dropping to 70000. This would be great if your in a sell now might take a day or 2 to get there but I'll wait if the monoooy is right lol. COINBASE:BTCUSD
