This could be the bull run we've all been waiting for.As of April 12, 2025, Bitcoin (BTC) is trading at approximately $84,892, reflecting a 1.5% increase as it attempts to break a three-month downtrend.
Several factors have contributed to Bitcoin's recent price surge:
1. U.S. Tariff Exemptions: The Trump administration's decision to exempt key tech products from reciprocal tariffs has alleviated trade tensions, boosting investor confidence in risk assets like Bitcoin.
2. Strategic Bitcoin Reserve: The U.S. government's establishment of a Strategic Bitcoin Reserve signals institutional support for digital assets, enhancing market sentiment.
3. Market Dynamics: A significant amount of Bitcoin has been withdrawn from exchanges, indicating strong holding sentiment among investors. Additionally, a short squeeze has contributed to upward price momentum.
Finance Magnates
4. Global Adoption: Institutions like Lomond School in Scotland accepting Bitcoin for tuition fees reflect growing mainstream acceptance of cryptocurrency.
Latest news & breaking headlines
BEARUSD trade ideas

Crypto Updated Short & Long-Term AnalysisStill staying patient even though we got in (at the perfect level) on the big 3, BTC, ETH, XRP.
As I mentioned previously, those were my initial entries and I am looking for further downside before entering with my full cash-allocation.
Here is what I'm looking for in terms of short-term rejection and deeper liquidity build - which will likely align with the broader market taking another tumble.
Happy Trading :)

bitcoin dips below 60kbitcoin dips below 60k, but we're unfazed.
i see this playing out as we move into the depths of winter,,,
this crypto winter ❄️
why would this happen, you ask?
the answer is simple: a stop-loss raid.
a sharp wave 4 designed to shake out weak hands.
distribution may have already started, hypothetically speaking, but it'll take the rest of the year to unfold.
think of it like the jan 2021 -> april 2021 vibe, only on a slightly higher degree and timeframe.
---
take note of the highlighted wave 2's and wave 4's on my chart.
what i'm illustrating is "the law of alternation," which states:
if wave 2 is flat, wave 4 will be sharp, and vice versa.
all the wave 2's in this cycle have been flats,
so by design, all of our wave 4's are set to be sharps.
this fits neatly into the larger cycle:
sharp retracements triggered by over-leveraged positions,
yet consistently bought up thanks to strong demand.
with each sharp retracement, however, the upward moves become smaller,
as momentum gradually fades.
---
w4 target: below 60k
w5 target: between 150k-200k (conservatively).
---
ps. i have recently shared a much more bullish idea via:

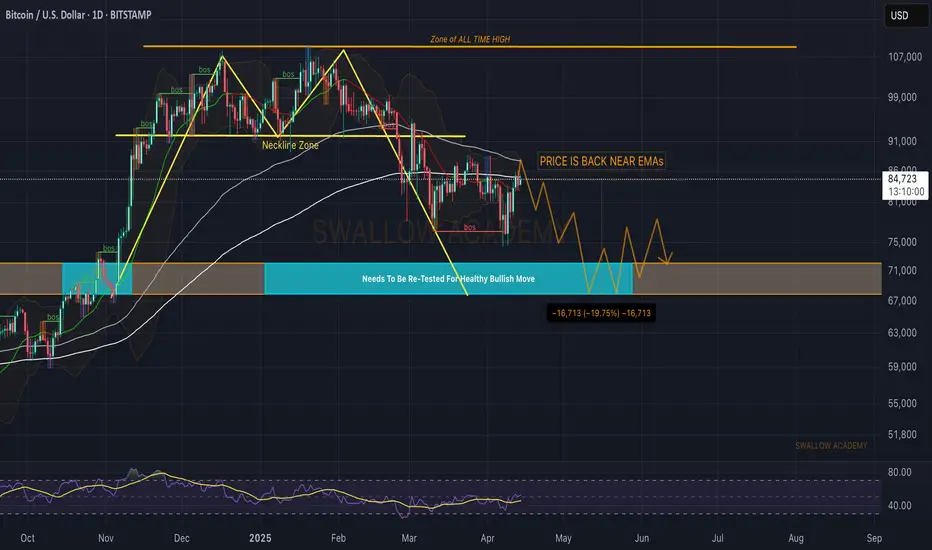
Bitcoin (BTC): Back at 100&200 EMA Zone | Important AreaBitcoin is back at a branch of EMAs where we are now looking for the price action and how the market price will reach this zone.
Now, in previous times, we have seen a good rejection that has sent prices back to lower zones so that's what we are expecting to see once again.
Once we see a weakness near the EMAs, we are going to aim for a major support zone on bigger timeframes.
Swallow Academy
BTC/USD 1H CHART PATTERN BTC/USD is currently facing strong resistance around the $84,000 level. If the price fails to break and hold above this zone, it may signal weakening bullish momentum. A stabilization below $84,000 increases the likelihood of a downward move, with the next target around $77,000. This level could act as key support, and a drop toward it may indicate a short-term bearish trend. However, if BTC manages to break above $84,000 with strong volume, it could resume its upward momentum. Until then, price action below resistance suggests caution, as bearish pressure may start building in the coming sessions.

BTCUSDWeekly accumulation and probably manipulation.
Would like to see a Daily market structure shift, with a FVG for a long trade.

87-88K seems natural targetMorning folks,
So, our 80-85K trade was nice. Now we think that it is not time for big trades, mostly because many markets, and especially US bonds and dollar are overextended. That's why for a few sessions we're focused on near standing targets.
BTC daily chart shows strong resistance around 87-89K area, which is also might be the neckline of potential reverse H&S. We already talked about this previously.
It is the 2nd reason why it would be better to focus on something close. Thus, on 1H chart setup might be looking like you see on the chart. We hope that 83K support will hold. Otherwise, this trade has no sense, because stop placement below 81K support makes risk/reward ratio unattractive.
Thus, supposedly 87-88K is an upside target. And we hope that BTC will stay above 83K.

BTC/USD... 1D CHART PATTREN...Here's is my 1-Day technical analysis for BTC/USD based on my setup:
---
Bitcoin (BTC/USD) – 1D Chart Analysis
Current Price: $84,500
Trendline Breakout: Confirmed (suggesting bullish momentum)
Position: Buy Initiated
Entry Zone: $84,000–$84,500
---
Technical Setup:
Breakout Type: Trendline breakout on daily timeframe
Volume Confirmation: Look for increased volume on the breakout candle (bullish sign)
Support Levels: $81,000 and $78,500
Resistance Zones:
Target 1: $94,000 – Psychological & Fib resistance
Target 2: $98,500 – Extended target, may align with overbought RSI levels
---
Indicators to Watch:
RSI: Should stay below 70 for healthy bullish momentum
MACD: If bullish crossover confirmed, supports further upside
EMA 50 & 200: Price trading above both = strong trend confirmation
---
Strategy:
Buy Zone: $84,000–$85,000
TP1: $94,000
TP2: $98,500
Stop Loss: Below $81,000 (to protect against false breakouts)
---
Let me know if you want a chart drawn or an intraday scalping plan based on this setup.

BITCOIN's 1D MA50 Flip = GREEN LIGHT for the NEXT BIG PUMP!Bitcoin (BTCUSD) closed Saturday's 1D candle above the 1D MA50 (blue trend-line) for the first time in more than 2 months (since February 03)! The 1D MA50 got tested and rejected the price 6 times since then. At the same time, the price marginally broke above the Lower Highs trend-line that started on the January 20 All Time High (ATH).
This is the most powerful short-term bullish combination as it was staged on a Bullish Divergence 1D RSI, which is on Higher Lows against the bearish trend's Lower Lows. Technically such break-outs immediate Target is the 2.0 Fibonacci extension, which now happens to be just below the $100k mark at $99500. In not such a coincidental fashion, that is he last Resistance level that run through February 05 - 21 before BTC's strong tariff sell-off.
So do you think the 1D MA50 break is the green light for a $99500 rally? Feel free to let us know in the comments section below!
-------------------------------------------------------------------------------
** Please LIKE 👍, FOLLOW ✅, SHARE 🙌 and COMMENT ✍ if you enjoy this idea! Also share your ideas and charts in the comments section below! This is best way to keep it relevant, support us, keep the content here free and allow the idea to reach as many people as possible. **
-------------------------------------------------------------------------------
💸💸💸💸💸💸
👇 👇 👇 👇 👇 👇

BTC/USD...4H chart pattren...To my analyze Bitcoin with a descending channel pattern, we'll consider the following key aspects based on your provided details:
1. Descending Channel Overview:
A descending channel is a technical pattern where the price is moving within parallel downward-sloping trendlines. In this case, the sell side implies that Bitcoin's price is expected to keep moving downward, adhering to the top line (resistance) and bouncing between the resistance and the lower support line.
2. Key Levels:
High Support (85,000): This suggests that Bitcoin has a significant support zone around the $85,000 price level. If Bitcoin reaches this level, there is likely to be buying pressure or a price bounce.
Sell Target (74,000): Your target suggests that you expect Bitcoin to drop to the $74,000 level, which would likely represent the lower boundary of the descending channel or a previous support zone.
3. Price Action Within the Channel:
If Bitcoin's price is currently within the descending channel and testing the upper resistance, traders might look for short opportunities (sells) at or near the resistance level.
The 85,000 support level could be tested again. If Bitcoin bounces off that level, the downtrend may continue, pushing the price toward the 74,000 target.
If Bitcoin breaks the 85,000 support, a deeper decline could be in the cards, and the sell target of 74,000 may need to be adjusted.
4. Potential Indicators to Watch:
Volume: Pay attention to volume, especially if Bitcoin approaches the 85,000 support level. A low-volume bounce may indicate a short-term relief rally before the next leg down.
RSI: The Relative Strength Index (RSI) can provide insights into whether Bitcoin is oversold or overbought, helping to confirm or challenge the trend within the descending channel.
MACD: A bearish crossover on the MACD can confirm downward momentum, reinforcing the sell setup toward your target of 74,000.
5. Risk Management:
As this setup involves selling in a descending channel, ensure you set stop-loss orders just above the resistance or the 85,000 level to protect against a reversal.
Adjust your stop-loss based on the price action in relation to the channel’s boundaries.
Conclusion:
Sell if Bitcoin reaches or tests the upper resistance in the descending channel (around 85,000).
Target 74,000 as the downside support.
Watch for volume, RSI, and MACD indicators to confirm the continuation of the downtrend or a potential reversal.
Would you like a more detailed chart or analysis using historical data to refine this strategy further?

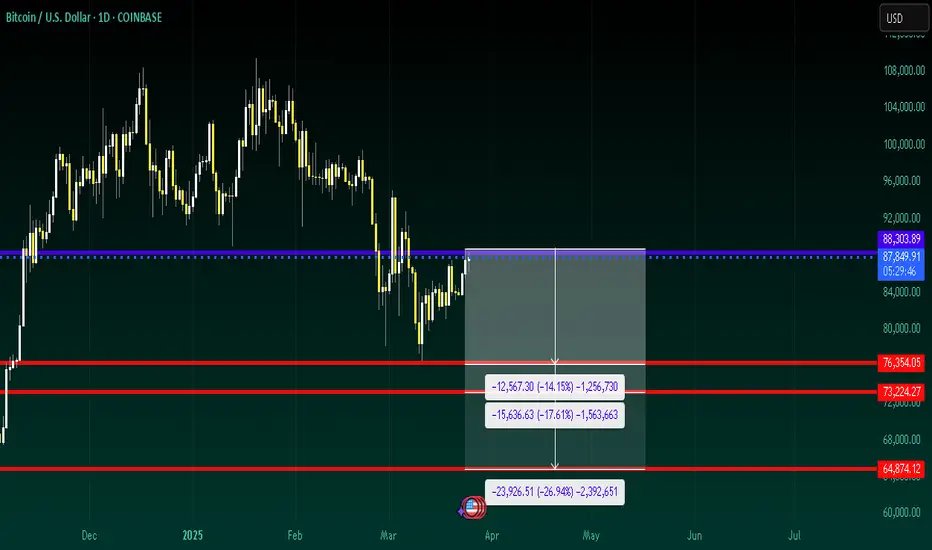
BTC to likely kiss the $74K - $69KBitcoin Market Analysis and Forecast
Bitcoin has retraced over 50% from its all-time high (ATH). Despite a rebound from the Fibonacci 50% level to its current price of $84,600, continued selling pressure could push BTC lower toward the Fibonacci 61.8% retracement zone, which lies between $74,000 and $69,000.
This potential pullback presents strategic entry points for long-term investors who have the patience to hold through market cycles.
Given the current market conditions, I will continue to accumulate using a Dollar-Cost Averaging (DCA) strategy to mitigate volatility and optimize long-term gains.
I will be monitoring the price action closely and providing further updates as the market develops.

BTCUSD Analysis Today: Technical and On-Chain !In this video, I will share my BTCUSD analysis by providing my complete technical and on-chain insights, so you can watch it to improve your crypto trading skillset. The video is structured in 4 parts, first I will be performing my complete technical analysis, then I will be moving to the on-chain data analysis, then I will be moving to the liquidation maps analysis and lastly, I will be putting together these 3 different types of analysis.

BTC?
Hi,
as at now.
There were no rush of price movement.
Which is great.. low volume n volatility for buyside.
Max I would pay this round is 85K
Lowest would pay 84.3k range
Tonight till 2D
Im looking at target 90-91K
(IF it respects my buyside.. = SL don't hit & don't break my supports)
Will trade on leverage / managing my SL apprx 1000points
All the best.
Manage well... never a guru.

Recent BTC hourly candles: Pure algo magick!Look at how these candles are playing with the lows and the body levels both algorithmically. This is HTF bot work

MORE SHORTS: SON OF A BITLike Comment Follow
comment a coin ill analyse
Continuation of the last post dont get your hopes up the shows not over
price at resistance broke the trendline retest no its continuing the bearish coninuation
notice how it didnt break strucutre yet 25 march is the structural high if you swing

BTC/USD @84,700 sell 4h chart analysistrade plan looks when interpreted as key support and resistance levels on the chart:
Resistance (SL): 86.500 — Strong resistance zone, price invalidation point
Entry Level: 84.700 — Near a potential resistance-turned-entry zone
Support 1 (TP1): 80.000 — First major support, possible bounce zone
Support 2 (Final TP): 75.000 — Longer-term support, possible reversal or consolidation area
This setup suggests you're expecting the market to respect 83.500 as a lower high or a failed rally, aiming for continuation to the downside. Watch for:
Bearish confirmation candles around 83.500
Momentum indicators showing divergence or downtrend strength
Price rejection or volume spikes near resistance
If you’re on a higher time frame (like H4 or Daily), this could be a strong swing trade setup. Want help drawing this up visually or adding confluence zones like Fibonacci or moving averages?

BITCOIN SHORT FORECAST Q2 FY25im expecting price to reject my point of resistance and drive down lower to the price levels in red
it did make a nice set of higher highs but didnt break any structure on the daily you notice that the structure leading to my
resistance has gotten shorter indicating weakness (clearer on h4)
i made a post on the short as it hit 102k im just insighting
more shorts ahead when reversal idk
last post
dont miss the 500 follower giveaway
BTCUSD Downside - Is Yesterday the swing high?Yesterday closed bearish, and there is a trendline break pattern suggesting a bears to enter the market.
Watching the recent two days low, if we can make a break below 83K then it should be clear sailing to the 80K mark.
Alternatively, a break above yesterdays high would signal further buying.
Watch this space!

Short on BTCUSDBitcoin (BTC/USD) – Bearish Outlook Amid Economic Uncertainty
We anticipate a short-term bearish trend for BTC/USD, driven by escalating economic concerns and the recent resurgence of trade tensions. The imposition of new tariffs has negatively impacted market sentiment, contributing to downward pressure on Bitcoin. The current price structure also suggests limited bullish momentum, favoring another potential sell-off.
From a technical perspective, forming a Bearish Butterfly Harmonic pattern further supports the expectation of a downward move.
Trade Setup:
Entry Level: 84,500
Take Profit 1: 78,500
Take Profit 2: 74,500
We recommend monitoring macroeconomic developments closely, as further deterioration could accelerate the bearish trend.

ALTS Season Starts in JuneALTS Season 2025 will be short and sweet.
Let the BTC collapse if you want the ALTS Season faster
Approximate date is June 9th


Macro resistance became support BTCUSD 4hBTC 4h broke through the long term resistance. Has already retested and is currently on the way up. This line is now support.
Will it break through the second long term support line which became resistance or will we go down again? Time will tell.

BTCUSDBitcoin is currently trading near 84,949 after a strong rally, now approaching a critical order block resistance near86,000. While the overall structure remains bullish, the chart signals a potential shift in market behavior—creating a clear discrepation between price structure and projected move.
Discrepation Breakdown:
1. Rising Trend vs. Order Block Reaction
- Expected: Uptrend to continue, breaking through the resistance zone.
- Actual: Price is hesitating and forming a double-top structure inside the order block, hinting at buyer exhaustion.
- Discrepation: A bullish structure failing to maintain momen…
- Recent candles show weak buying volume near the top despite higher prices.
- Discrepation: Price is rising, but volume is not supporting it—bearish divergence, weakening the bullish outlook.
4. Fair Value Gap (FVG) Overlap
- FVG zone around 82.2k aligns with the bearish target, giving confidence to downside movement.
- Market may seek to fill that gap, creating a conflict with the bullish price structure currently visible.
Discrepation Summary Table:
| Technical Element | Market Expectation | Observed Conflict
| Uptrend + Higher Highs | Continuation toward 86,000+ | Double-top …
Although Bitcoin remains in a short-term uptrend, this chart shows clear bearish discrepation. The failure to break the order block, combined with volume divergence and trendline pressure, suggests a potential drop toward $82,232, especially if price confirms the double-top and breaks the ascending trendline.
Would you like a short version of this for social media captions too?
