BITCOIN Will Move Lower! Sell!
Take a look at our analysis for BITCOIN.
Time Frame: 30m
Current Trend: Bearish
Sentiment: Overbought (based on 7-period RSI)
Forecast: Bearish
The market is testing a major horizontal structure 79,880.44.
Taking into consideration the structure & trend analysis, I believe that the market will reach 78,453.18 level soon.
P.S
The term oversold refers to a condition where an asset has traded lower in price and has the potential for a price bounce.
Overbought refers to market scenarios where the instrument is traded considerably higher than its fair value. Overvaluation is caused by market sentiments when there is positive news.
Disclosure: I am part of Trade Nation's Influencer program and receive a monthly fee for using their TradingView charts in my analysis.
Like and subscribe and comment my ideas if you enjoy them!
BEARUSD trade ideas

Bitcoin 1hr Update, Retrace To Continue HigherBitcoin from the 1hr pov will drop to the area between $78850 - $77555 to then bounce and continue higher but just to test the $82865 Res line, and as long as the Daily is in extended Bearish mode every bounce will be short lived to then continue lower until the Daily exits the Bearish mode.

Bitcoin IndecisionBitcoin printed a small bounce yesterday after a strong breakdown, but the technicals remain mixed. Let’s break it down.
The most obvious development is the **death cross** – the 50 MA has now crossed below the 200 MA. While this is considered a bearish signal, it’s also a **lagging indicator**, often reflecting past weakness rather than predicting future price action. The last time we saw a death cross on the daily chart, it came near the bottom, so take it with a grain of salt.
More interesting is yesterday’s candle – a small-bodied candle with long wicks on both sides, forming something of a **doji**. That reflects indecision after a high-volume breakdown. Bulls stepped in to defend just above the $73,800 support zone, which aligns with the May 2024 all-time high and previous resistance turned support.
Price is still trading well below both moving averages, which are now resistance. The triangle breakdown remains intact, and momentum has clearly shifted lower – but holding this horizontal support zone would at least keep the higher timeframe bullish structure alive.
In short: **death cross, indecision candle, and a critical support retest**. Bulls need to prove themselves quickly – otherwise, the path of least resistance could remain down.


Confluence at 65KBTC seems to be developing a bullish Gartley pattern, currently evolving within a potential bear flag.
The pattern would complete at point D, around $64,600–65,000, where multiple confluences meet:
- 78.6% retracement of XA
- 141.4% extension of BC
- Lower boundary of the flag
- Retest of former resistance trendline
- Saylor’s average entry price 😏
A key condition: we need to break below the current wedge to increase probabilities of reaching point C.
Until then, the pattern remains a setup in progress.
Letting it unfold, one leg at a time.

Bitcoin Bubble at $70K? Prepare for ImpactBitcoin recently faced strong rejection near the $81,000 level, forming a potential double top pattern on the higher timeframes. This classic bearish reversal setup is now playing out, as price action has begun to decline from the second peak.
Adding to the bearish confluence, the MACD has confirmed a bearish crossover, signaling weakening momentum and a potential trend reversal. The rejection at $81K aligns with historical resistance, and price has failed to break above it despite multiple attempts.
Going forward, there are two key scenarios to watch:
Retest of the $76,700 zone – A minor support area that could offer a bounce or consolidation before the next move.
Deeper pullback towards $70,000 – If bearish pressure continues, CRYPTOCAP:BTC could head lower to test this psychological and technical support level.

BITCOIN EMERGENCY!!!Please refer to my previous ideas on bitcoin it’s been a good flow on mapping where it goes :)
Bitcoin do historic moves we rally to 300k soon
Then eventually 2 million by 2030 see you guys on mars

The last bullish chance of Bitcoin in mid-term !!BTC is in a Falling Wedge Pattern. This means The Bulls Have Higher Chance To Claim The Trend Than Bears! No Break out Has Happened yet and we shall wait for a Break out But It should Happen Pretty Soon Because there is also a Regular Bullish Divergence On MACD as well! So The Bullish Chance for BTC Is Pretty High and we Shall see a Bullish Movement Up to $100K Pretty Quick!
-BTC is in a Falling wedge Pattern
-No Break out
-(+RD) on MACD
Give me some energy !!
✨We spend hours finding potential opportunities and writing useful ideas, we would be happy if you support us.
Best regards CobraVanguard.💚
_ _ _ _ __ _ _ _ _ _ _ _ _ _ _ _ _ _ _ _ _ _ _ _ _ _ _ _ _ _ _ _
✅Thank you, and for more ideas, hit ❤️Like❤️ and 🌟Follow🌟!
⚠️Things can change...
The markets are always changing and even with all these signals, the market changes tend to be strong and fast!!

CHECK BTCUSD ANALYSIS SIGNAL UPDATE > GO AND READ THE CAPTAINEntry Zone: Around 79,200 USD (blue shaded box).
Stop Loss: Marked in red at 79,500 USD (to limit losses if the trade goes against you).
Take Profit Targets:
Take Profit 1: Around 78,750 USD
Take Profit 2: Around 78,500 USD
Last Target: Around 78,250 USD

BTC/USD) Bullish reversal analysis Read The ChaptianSMC Trading point update
This is a bullish reversal analysis on BTC/USD (Bitcoin to USD) on the 4-hour chart, suggesting a potential long opportunity after a sharp corrective move.
---
Key Breakdown of the Chart:
1. Strong Downward Move with Potential Reversal:
Bitcoin experienced a sharp drop from the 88k region to ~74,387.50, now hitting a key demand zone (marked as "Orderblock").
2. Bullish Reaction Expected:
From the Orderblock support zone, a bullish reversal is anticipated.
The projected move aims to fill the imbalance and test the target zone between 87,152.94 and 88,557.14.
3. RSI Oversold:
RSI is around 32.27, indicating oversold conditions and adding confluence for a potential bounce.
4. EMA (200):
The 200 EMA lies around 85,153.85, which may act as dynamic resistance on the way up.
Mr SMC Trading point
5. Price Target:
The expected upside move is approximately +13,722.85 points (+18.75%), aiming for the supply zone above 87k.
---
Conclusion / Trade Idea:
Entry Zone: Near 74,387.50, the orderblock/demand area.
Target Zone: 87,152.94 – 88,557.14
Bias: Bullish short- to mid-term reversal.
Confluences: Oversold RSI, clean support zone, potential trendline bounce, and price inefficiency above.
---
Pales support boost 🚀 analysis follow)

BITCOIN Is it still on track with past Cycles??Bitcoin (BTCUSD) saw a strong correction last week as well as early trade yesterday on Monday, along with all major stock markets, but had an equally impressive round on Wall Street opening, which keeps it so far above its key 1W MA50 on a potentially weekly closing.
So the critical question now is this: Will it continue the pattern of past Cycles and give one more major rally in 2025?
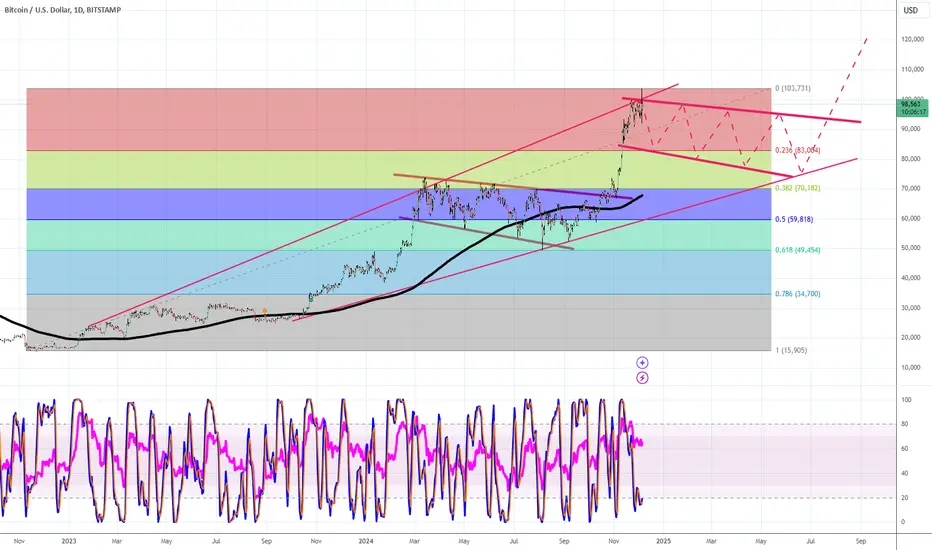
Well based on the BTC Rainbow Waves, it is still on track and actually in a similar situation as July 2013 when after a 3-month correction/ pull-back sequence, it got back to the Blue Buy Zone and near the Fair Value green trend-line.
As you can see all Cycles peaked on the Red Zone and so far on this Cycle we haven't even reached the 1st orange trend-line. Based on the Time Cycles, the next peak should be around November 2025 and if the price action confirms the Rainbow Wave model again, the closest level to the Red Zone by then would be around $180000.
Do you think that amidst the trade war chaos, that's a realistic expectation? Feel free to let us know in the comments section below!
P.S. I am attaching a snapshot below in case the waves aren't displayed properly on the chart above:
-------------------------------------------------------------------------------
** Please LIKE 👍, FOLLOW ✅, SHARE 🙌 and COMMENT ✍ if you enjoy this idea! Also share your ideas and charts in the comments section below! This is best way to keep it relevant, support us, keep the content here free and allow the idea to reach as many people as possible. **
-------------------------------------------------------------------------------
💸💸💸💸💸💸
👇 👇 👇 👇 👇 👇

Btcusd Sell Looking for A Sell on Btcusd.
Btcusd has been on bearish for a long time.Has structures been omitted and characters changed, liquidity on a buyside sweept.
Btcusd will be fully on bearish.

BTC SELL OPPORTUNITYBTC SELL OPPORTUNITY
The downward trendline of BTC has been
formed at 4H chart, and the price has
down broken the key point,which is around
85000
Therefore, continue to sell BTC when the
price pull back around 81000-82000
SL: above 83500
TP#1: 76500
TP#2: 74500

Bitcoin Forecast for the Next 15–20 Years!Bitcoin Forecast for the Next 15–20 Years
Bitcoin is currently in the early stages of its development, both in terms of market adoption and price stability. While there is a possibility that Bitcoin will reach a higher value in the future, it is unlikely to hit the milestone of one million dollars in the short term—mainly due to the volatility and uncertainties associated with cryptocurrency regulation. The coming years will be crucial for the further evolution of Bitcoin. Factors such as technological advancements, government policy, and market acceptance will determine whether Bitcoin can develop into a more stable and widely adopted currency.

BTCUSD-Retrace To Continue HigherHello, traders
Bitcoin from the 1hr pov will drop to the area between $78850 - $77555 to then bounce and continue higher but just to test the $82865 Res line, and as long as the Daily is in extended Bearish mode every bounce will be short lived to then continue lower until the Daily exits the Bearish mode.

Bearish Bitcoin Faces Key ResistanceFenzoFx—Bitcoin trades bearishly below the critical resistance level of $81,160. If the price remains below this level, the downtrend will likely resume, targeting $74,000.

short op in BTCUSD on support turned resistanceShort opportunity on BTCUSD where support has turned resistance at $81k, tight stop at $81712, take 50% at $79390 and the rest at $74619

BTC Analysis – Trading in No Man’s Land as Channel Support LoomsHello Traders,
Today’s intraday Bitcoin analysis focuses on the 4-hour timeframe, where price action has continued to unfold within a clearly defined descending channel. After rejecting off the channel high resistance, BTC is now drifting downward toward key support — but hasn’t quite reached it yet. Current movement suggests indecision, with price hovering around the range midpoint.
Key Technical Points:
• Price is trading within a descending channel, currently stuck around the range mid, showing uncertainty and lack of momentum.
• Channel low support sits around $65,500, which bulls must defend to avoid further downside and trigger a potential rotation back to the highs.
Conclusion:
Market structure remains bearish, with consecutive lower highs indicating ongoing weakness. A break of the channel to the upside would require a clear shift in structure — something not yet visible. Until then, lower lows remain a likely scenario. Traders should exercise caution in this zone, as price remains vulnerable to further downside in the short term.

BTCUSD TECHNICALS & FUNDAMENTALSKey Technical Details:
Support: Price is resting on the lower trendline of the channel and right above a potential breakout level.
Resistance: The upper channel line sits around $85,000, which aligns with the previous rejection zone.
Bullish Scenario: If BTC bounces off this level and breaks above the short-term resistance, expect a potential move toward $85K and beyond.
Bearish Scenario: A clean breakdown below the trendline could take BTC back to $77,000–$75,000.
Volume Note: There's a notable decrease in volume, indicating indecision—often a sign of a potential breakout soon.
💡 Bias:
Currently neutral to bullish as long as BTC stays within the channel.
📰 Fundamental Analysis (April 8, 2025)
🧨 What’s Moving the Markets Today:
Fallout from April 7’s Inflation Print:
The U.S. CPI data came in hotter than expected, rekindling fears of delayed Fed rate cuts.
This led to panic selling across equities, forex, and crypto on April 7. BTC dropped sharply in reaction.
🌍 Today’s Probabilities:
Macro Uncertainty Continues:
With the inflation shock still rippling, risk-on assets like Bitcoin are in a sensitive zone.
Traders await Fed speakers and FOMC minutes later this week for further cues.
🏦 Institutional Sentiment:
Cautiously Bullish: Institutions aren’t exiting yet, but are being very selective.
BTC’s long-term structure remains strong unless it breaks down from the channel.
✅ Summary:
BTC is consolidating after a post-CPI dump.
A bounce here could send it toward $85K, but a breakdown risks retesting $75K.
Fundamentally, macro pressure remains, so any bullish breakout must be backed by a shift in market sentiment.

Bearish drop?The Bitcoin (BTC/USD) is rising towards the pivot which lines up with the 50% Fibonacci retracement and could drop to the 1st support which is a pullback support.
Pivot: 81,250.81
1st Support: 74,377.30
1st Resistance: 84,581.33
Risk Warning:
Trading Forex and CFDs carries a high level of risk to your capital and you should only trade with money you can afford to lose. Trading Forex and CFDs may not be suitable for all investors, so please ensure that you fully understand the risks involved and seek independent advice if necessary.
Disclaimer:
The above opinions given constitute general market commentary, and do not constitute the opinion or advice of IC Markets or any form of personal or investment advice.
Any opinions, news, research, analyses, prices, other information, or links to third-party sites contained on this website are provided on an "as-is" basis, are intended only to be informative, is not an advice nor a recommendation, nor research, or a record of our trading prices, or an offer of, or solicitation for a transaction in any financial instrument and thus should not be treated as such. The information provided does not involve any specific investment objectives, financial situation and needs of any specific person who may receive it. Please be aware, that past performance is not a reliable indicator of future performance and/or results. Past Performance or Forward-looking scenarios based upon the reasonable beliefs of the third-party provider are not a guarantee of future performance. Actual results may differ materially from those anticipated in forward-looking or past performance statements. IC Markets makes no representation or warranty and assumes no liability as to the accuracy or completeness of the information provided, nor any loss arising from any investment based on a recommendation, forecast or any information supplied by any third-party.

Bitcoin - Are we there yet?Bullish weekly divergence
FBD of bullish expanding megaphone
On daily that double bottom area has positive divergence
Think we are at a good place.
May move slowly... then fast... as DXY looks like it may slowly go up this month. But there has been a lot or downside on the DXY the market hasn't seem to of priced in yet. So for prediction
DXY - up slowly for April while bitcoin also goes up
Down for May & June, finds low early July - end of bull run
Not financial advice.

The 100.000 was a fake try!We will go into a long consolidating phase of some month.
Afterwords we will see a new breakout!
Is Bitcoin in one big parallel channel?Are we at the bottom of a massive parallel channel?
This seems like a good place to buy.
Also be prepared to buy at the weekly 200MA, if that happens.
