Btcusdt technical analysis.Btcusdt technical analysis forecast at h1 time frame next move possible.not financial advise
BEARUSD trade ideas


BTC Market Update: Upside Move ImminentBTC Market Update: Upside Move Imminent
Bitcoin has successfully grabbed downside liquidity, setting the stage for a potential upside move.
Key Insights:
- The market has formed a Confirmation of Inverse Strength Distribution (CISD), indicating a bullish reversal.
- The marked swing highs are being tested, and a breakout above these levels could confirm the uptrend.
- The target zone of $84,400 is now in sight, with the market poised to challenge this level.
Trading Hypothesis:
- A sustained move above the marked swing highs could propel BTC towards the $84,400 zone.

BTCUSD ready for recovery Hi traders this is the first analysis shared by mpho January,why I saw that sell according to the strategy I counter price actions and always 99% right there is things that market create before it picks a manipulation I've experienced that both in stock markets and crypto soo in order to find proper trend I don't only use one strategy but I combined them into one thing meaning,I spot both support n resistance,candstick confirmation highs and low flags and this combinations brings 99% to 100% results the only thing is to not be in hurry and follow the trend,now am expecting strong rejection from previous high which is 75_68k as am saying I am positioning my selfs for better returns in this support zones✍️

Bitcoin I know it is crazy but it can happen we have 3 levels 75k is the first 61k is the second and 33k is the final dip level for this bull run bottom it sounds crazy I know my levels I am not saying I will hold my short till 33k I will manage my risk and I am also not going with my stop loss I will add mu hedges what i am doing i know just be careful buyers

any day now moon shot to $130,000 then its going down to...any day now we will have a moon shot to $130,000 by march 25 2025 and that will be the top then we are going to a financial reset
Alt coins will 50x before they retrace %98
bitcoin will go down to $17,500 by October 2025
not a financial advise

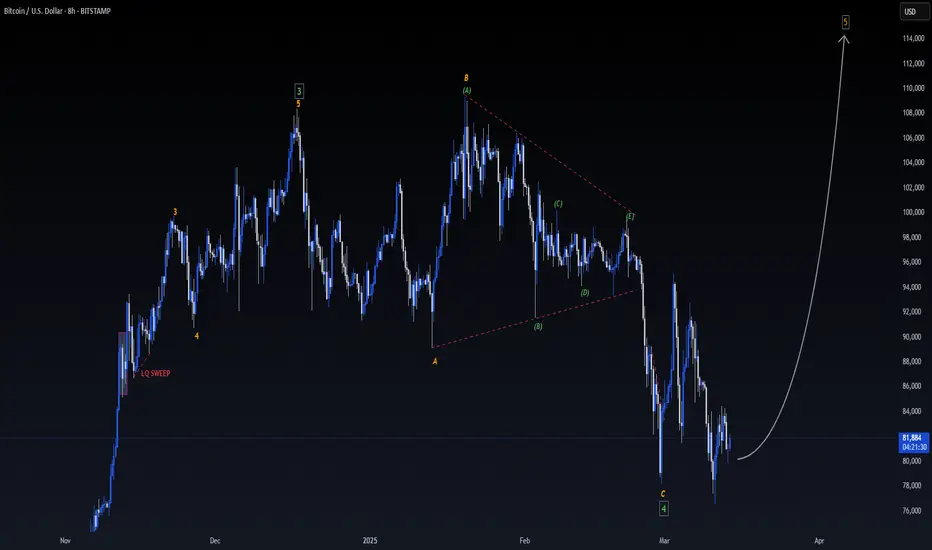
BITCOIN BULLISH TO $116?!After a redistribution phase where late buyers got wrecked at the top the market, we've seen price drop back down liquidating multi-billions in buy orders in the past few weeks. I believe this Wave 4 shakeout will now be followed by another bull run.
Blood Moon Bottom? Lunar Study on Bitcoin Price Action.In my years as a commodity trader, it crossed my desk multiple times the incredible frequency in which full moons aligned with significant price action sessions amongst precious metals; almost with a degree of precision that is hard to believed if measured too closely.
Tonight there will be the first Blood Moon since 2022, which stood out to me on the session that gold set new all time highs and silver showed signs of incredible strength and momentum.
I was curious of the rarity of Blood Moons, and upon learning the date of the last occurrence, something stood out to me. I knew it was right around the time that the FTX disaster found a bottom, and a new bull market kicked off in equities on the back of AI exuberance.
Then I looked a little closer. They were not just close in proximity, but the last Blood Moon occurred nearly at literal Bitcoin bottoms in the wake of the FTX disaster .
Whoa. Okay, certainly there are coincidences out there, and I've seen technical analysis referred to as "astrology for men" enough times to exercise a little restraint on this topic, but I found it fascinating.
Will this Blood Moon mark a local low before resumption of bullish momentum? Will equities have marked a bottom too?
RSI around both events reached very similar levels too.
For those that want to investigate further, check out the 2014 Blood Moons on top of a Bitcoin chart.

follow up to previous post We're still in a downturn, haven't seen any news that indicate we'll be testing new highs. lower lows incoming 73k-75k i where ill have my TPs

BTC Today's strategyIndustry News: Japanese listed company Metaplanet increased its holdings of 162 BTC, which to some extent reflects institutional optimism towards Bitcoin, and may have a positive impact on market sentiment, attracting more investors to pay attention and buy. However, Bitcoin's real-world application is still relatively limited, and its fundamentals are still relatively weak, which may limit the price of Bitcoin in the long run.
From the supply side, after bitcoin hit its highest price in history, short-term holders (STH) increased their holdings, while long-term holders (LTH) decreased their holdings. This change in supply pattern reflects the growing speculative atmosphere in the market, and short-term traders are more sensitive to price fluctuations, which may lead to increased volatility in bitcoin prices. From the demand side, despite the continued increase in bitcoin holdings by institutional buyers and ETFs, actual spot demand continues to decline. If demand does not recover, bitcoin's continued rally may be difficult to maintain.
Overall, the price of Bitcoin on March 14, 2025 is currently showing a certain upward trend, but the overall trend is still facing many uncertainties. A variety of factors such as the macroeconomic environment, the Federal Reserve's monetary policy, industry dynamics, and market supply and demand are all having an impact on the trend of Bitcoin.
buy:77K-79K
tp:83K-85k
We will share various trading signals every day. Fans who follow us can get high returns every day. If you want stable profits, you can contact me.

last retest before new lowsWe've made it out the resistance/support zone that we've been observing for the last couple of days. I think we will be rejected hard and go form new lows.

BTCUSD DOWN TARGET SUCCESSFUL DONE READ IN CAPTIONSBitcoin (BTC/USD)* on a 1-hour time frame, showing price action, a channel formation, and key support and resistance levels.
Key Observations:
1. Price Movement in a Channel:
The chart clearly displays Bitcoin's price moving within a descending channel, indicated by the blue lines. This suggests a bearish trend, where the price is making lower highs and lower lows. The price has recently approached the support level and is testing it once again.
2. Resistance Zone:
The resistance zone is marked in red, highlighting the upper boundary of the channel, around 81,800 to 82,000. This is the region where Bitcoin has struggled to break above, making it a critical point to watch for potential reversals or a breakout.
3. Support Zone:
The support zone is indicated by the red box on the lower part of the chart, around 80,200. This is where Bitcoin’s price has consistently bounced in the past, making it a potential area to consider for entering buy positions.
4. Target Completion:
The target price for the current move has already been hit at80,200, as shown by the “TARGET COMPLETE” label. This suggests that the market has reached the projected support level, completing the move to the downside.
Trading Strategy:
- Sell Setup: If Bitcoin fails to break above the resistance at 82,000, there could be a potential continuation of the bearish trend towards the support at 80,200.
- Buy Setup: If the price holds at the support zone of 80,200 and shows signs of reversal, traders might look for a buying opportunity targeting the resistance at 81,800 - 82,000.
- Stop Loss: To protect against potential reversals, a stop loss could be placed just above the resistance level around 82,500.
Conclusion:
This chart shows Bitcoin's price movement within a descending channel, with a target price at 80,200 already hit. Traders should pay attention to the resistance at 82,000 and support at $80,200 for potential trade opportunities. The market could continue to consolidate within this range or break out in either direction, depending on the price action.

Downturn in traditional markets will suck liquidity from Crypto.For what feels like the longest time I have had my eye on the CME gaps down at approx 11k and 9.5k.
I still feel like a retrace to these levels is possible should a significant enough downturn in traditional markets occur.
I would look at placing buy orders at these levels (as well as on the way down to there) in anticipation of there being a rapid cascade of liquidated longs.
Such a retrace would not be uncommon for Bitcoin, and targeting these levels would be a great way to load up on shockingly cheap coin while weak hands and excess leverage are shaken out of the market.
Obviously, altcoins would be affected also.
I would not trust any stable coin that has market exposure as part of their stabilizing mechanism.
XAU and PAXG are probably the "safest" places to keep un-allocated capital.
Thoughts and insights are welcome.

BTC - Short-Term Short Position.BTC on the Daily for the thesis: general idea is a continuation of the overall bearish trend, but in context of the monthly & weekly TF, where we have an FVA residing at the FWB:73K level, meaning that could be our low before a potential reversal to a new ATH, in line with Monthly market structure.
If we dont come lower from here, expect higher prices, but, my money is on 73-75K levels being tapped before any reversal higher.

Learn To Invest: Global Liquidity Index & BitcoinGlobal Liquidity Index & BitCoin:
🚀 Positive Vibes for Your Financial Journey! 🚀
BITSTAMP:BTCUSD
Look at this chart! It's the Global Liquidity Index , a measure of how much extra money is flowing through the world's financial systems.
Why is this important? Because when this index is high, it often means good things for investments like #Bitcoin! 📈
Think of it like this: when there's more money flowing, people are often more willing to take risks and invest in things like Bitcoin.
See those "BullRun" boxes? That means things are looking bright! It's showing that money is flowing, and that's often a good sign for potential Bitcoin growth. 🌟
Even if you're not a pro, it's easy to see the good news here. Understanding these trends can help you make smarter decisions.
Let's all aim for growth and success! 💪

Start to buy BTCI think the price of bitcoin will reach the bottom in soon. We can start to build up BTC positions in batches. 30% and 30% until the price reach $61K if possible.
I think that the sell price may be 1BTC/$120K!

Bitcoin (BTCUSD) Rejection – Bearish Move Incoming?📉 Key Observations:
Resistance Zone (Purple Box): Price has tested this area and faced rejection.
Bearish Projection (Gray Box & Arrow): The chart anticipates a drop towards the $76,800 - $77,000 range.
Liquidity Grab? Price might consolidate before a sharp decline.
⚠️ Possible Scenarios:
Rejection Confirmation 🔻: If BTC fails to reclaim $84,470, selling pressure could increase.
Breakout Fakeout? 🤔: A deviation above resistance followed by a dump remains a risk.
🎯 Levels to Watch:
Resistance: $84,470 - $85,078
Support: $80,000 and $76,825
🔥 Final Take: If BTC struggles below resistance, a short setup could play out. Confirmation is key!

bitcoin 2025btc and time
Ladies and gentlemen, let me tell you something. Bitcoin, digital currencies, it's the future. No doubt about it. The world is changing. We’re moving into the 21st century faster than ever before. And folks, the only way to keep up—truly keep up—is to embrace this technology. We have to adapt, we have to move forward, or we’ll get left behind. Believe me.
Now, some people, they’ll tell you that Bitcoin is too volatile, that it’s too risky. Well, let me tell you something. Nothing worth doing is ever easy, okay? There are always going to be risks. But Bitcoin, digital money, it’s the future. It’s the future of finance. And let me tell you, it’s already happening. We have the biggest companies, the smartest people, they’re all talking about it. Tesla, MicroStrategy, you name it. They’re already in. So why aren’t we? Why aren’t we moving faster? That’s the question. We have to be smart. We have to get ahead of the game.
Look, I’ve seen it all—the stock market, the banks, the big banks. They don’t get it. They don’t understand how fast things are changing. But Bitcoin and digital currencies—they understand change. They understand innovation. And that’s what we need. We need innovation, folks. We need to update our systems, we need to update our country. We need to update the way we think about money.
Some people say it’s just a trend, just a bubble. I’ve heard it all before. You know what? They said the same thing about the internet. They said the same thing about smartphones. And look at us now. We don’t want to be the last ones to figure it out. We want to be the first. We want to lead. And that’s what we’re going to do.
So I say to you, the future is bright. We’re talking about an economy that moves faster, more efficiently. It’s the future, folks. We need to make sure we’re part of it. Digital money is coming whether we like it or not, so we’d better make sure we’re on top of it.
And let me tell you, it’s going to be big. The biggest. The world is looking to us. They want us to lead, and I believe we will. We’re going to make sure America is at the forefront of digital finance. We’re going to make sure we’re ahead of the curve. And we’re going to win. We’re going to win big. Thank you, God bless you, and God bless America!

BTCUSD Analysis Today: Technical and On-Chain !In this video, I will share my BTCUSD analysis by providing my complete technical and on-chain insights, so you can watch it to improve your crypto trading skillset. The video is structured in 4 parts, first I will be performing my complete technical analysis, then I will be moving to the on-chain data analysis, then I will be moving to the liquidation maps analysis and lastly, I will be putting together these 3 different types of analysis.

I BELIEVE BTC WILL DROP SINCE THE MARKET VOLUME IS LOW AT TIME A bearish trend is unfolding in the Bitcoin market, presenting a potential short opportunity. The recent price action has been characterized by a lack of upward momentum, and the market's overall sentiment has shifted towards the downside.
Technical Analysis
- Bearish Trend Line Resistance: The chart is showing a clear bearish trend line resistance, indicating a potential reversal.
- Low Market Volume: The current market volume is low, suggesting a lack of buying interest and increasing the likelihood of a downward move.
- RSI Oversold: The Relative Strength Index (RSI) is not oversold, but the price action suggests that the market is due for a correction.
- MACD Bearish Crossover: The Moving Average Convergence Divergence (MACD) is showing a bearish crossover, indicating a potential trend reversal.Trade Rationale
This trade is based on a combination of technical and market sentiment analysis. The bearish trend line resistance, low market volume, and MACD bearish crossover all suggest that the market is due for a correction. The RSI is not oversold, but the price action suggests that the market is due for a pullback. its not financial advise

Bitcoin Weekly LINEAR chart shows possible re run of 2021 2X ATHI was just looking at this Linear chart and spotted a couple of things.
So many people Use LOGARITHMIC charts.
In summery, A logarithmic chart is a graphical representation that uses a logarithmic scale, which differs from the conventional linear scale. In a logarithmic scale, the distance between values is not constant but increases by a factor, making it useful for datasets with a wide range of values. This approach helps in presenting numerical information more efficiently and allows for a better visualization of rates of change or percentages rather than absolute values.
A LINEAR chart however, shows you the REAL rate of change.
And on This Linear chart, I have noticed that PA is creating a very Similar Top to the MARCH ATH of 2021
I do not think we will follow it perfectly, as that drop in 2021 was over 50% and that would take us down to 52K, which I think is not a real possibility. But, being open to ALL possibilities, that trend line that was used by PA to bounce to the Nov ATH currently sits around 65K But the longer we wait, it heads higher, towards the 1 Fib ext around the Old 2021 ATH near 70K ( 69300)
Also note, how once PA had Dropped in March 2021, it levelled out and slide sideways for around 7 weeks.
So if we come over to Today, we have just dropped around 30% and seem to have found a Floor around 76K
We HAD to drop out of that Upper range box - It would have been December before we found support on the rising Trend line that has been the trigger for moves higher since 2023
And so, we have dropped to a Lower Range Box ( hopefully ) and this box hits the Rising trend line around June.
This has confluence with a number of other charts
And if we do range sideways, around this level, it is similar to that Range after the drop in 2021.
In 2021, after that range, PA rose by around 122%
I am not to sure we would see that but................
So now we wait to see if we stay in this range or not, with a top around 90K
We could See wicks out of this Range, down to the 70K mark maybe, with swift recovery.....
We may also see further Drop....
there is abcolutly NO guarentee that we will even head higher again.....
We have to wait and see and have plans and stick to them..for both BULl and BEAR

BEARISH AND BULLISH SCENARIOI'll use harmonics for both bearish and bullish case. ASSUMING that the top is in, ABCD bearish scenario is in play. Congratulations to those who have shorted :) For the bullish case scenario, I'm seeing a Cypher pattern, which directs us to the 40k region and I think this will be the accumulation of whales in preparation for the next cycle. In connection to my previous post using my crude representation of the waves, 40k area is the legendary trading zone and it might be tested as a support that will take us to 200k+ next cycle. Just my two cents. Good luck trading.

My analysis suggests BTC will decline because of high market I'm expecting a downturn because the market was hovering around this level yesterday, so now I'm concentrating on the downside so our focus on sell its not financial advise
