Where can Bitcoin turn bullish again? (2D)Before anything, pay attention to the timeframe of the analysis. This is a 2-day timeframe, so it will take time.
The green zone is where Bitcoin can start moving toward the specified targets. If the ATH is broken, Bitcoin could also move toward $120K and $140K. However, based on the chart, there is currently no certainty about Bitcoin’s final target.
Reaching the green zone may take more than 4 to 5 weeks.
We are looking for buy/long positions in the green zone.
A daily candle close below the invalidation level will invalidate this analysis.
For risk management, please don't forget stop loss and capital management
When we reach the first target, save some profit and then change the stop to entry
Comment if you have any questions
Thank You
BEARUSD trade ideas

CHECK BTCUSD ANALYSIS SIGNAL UPDATE > GO AND READ THE CAPTAINTrade Setup:
Current Price: Around 75,896
Entry Zone: Near 76,000 (highlighted by a blue rectangle)
Targets:
1. Take Profit 1: 76,500
2. Take Profit 2: 77,500
3. Last Target: 78,000
Stop Loss 75,250
FALLOW RISK MANAGEMENT ✅

#BTCUSDT.. single supporting area, holds or not ??#BTCUSDT. perfect move as per our last couple of ideas regarding #btcusdt
Now market have current supporting area that is around 82300
Keep close that level because if market clear that level then we can expect a further drop towards downside next areas.
Good luck
Trade wisely

BTC Setting Up for One More Drop? Eyes on 72K SweepBitcoin is moving in line with its projected bearish trend. We’re likely to see more short-side movement with imbalance being cleared toward the 72K zone. Watch how price behaves around 66.5K–68K for any reaction — but for now, momentum favors the bears. follow for more insights , comment , and boost idea

April 4 Bitcoin Bybit chart analysisHello
It's a Bitcoinguide.
If you have a "follower"
You can receive comment notifications on real-time travel routes and major sections.
If my analysis is helpful,
Please would like one booster button at the bottom.
Here is the Nasdaq 30-minute chart.
There are indicators released at 9:30 and 12:00.
First of all, Nasdaq reached a very important point on the chart
yesterday morning.
In a situation where there is no particular movement due to Trump's tariff policy,
it continues to flow downward.
As far as I remember, the US is a country with a lot of showmanship.
I've experienced it a lot while analyzing charts.
There are two indicators released today,
The Bollinger Band monthly central line touches on the chart + two indicators released,
so there is a very high possibility that Nasdaq will go up.
In the end, it's an action and a play on words to pick up and put down the ants,
and it won't be operated to the point where the US is destroyed.
Since there is a stop loss, we proceeded very aggressively.
As you can see, in the indicator announcement time zone,
the blue finger is short->long
or the red finger is long.
The rebound from the bottom is a condition for a sweep when looking at the chart upside down, so if successful, a surge can occur.
I just applied it to Bitcoin.
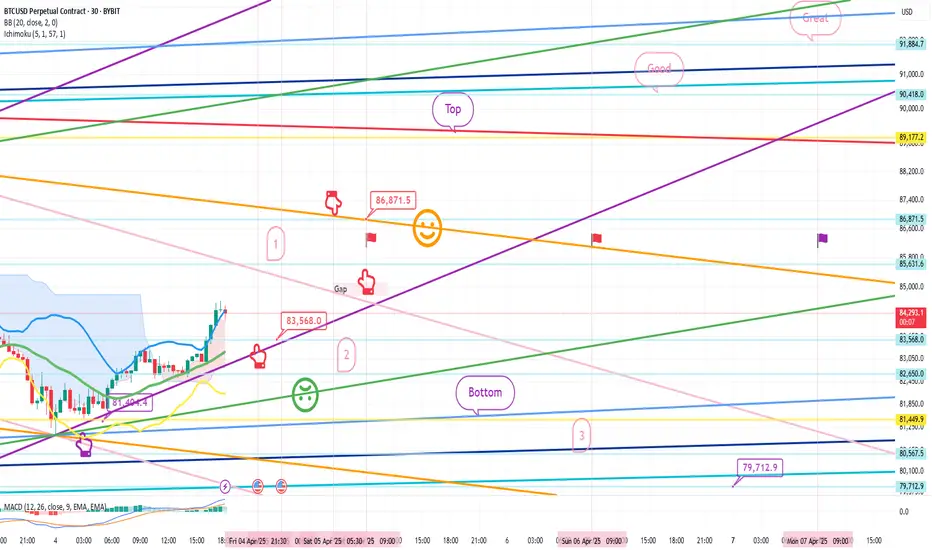
This is a 30-minute Bitcoin chart.
I marked the daily closing section for each flag,
and the purple flag on the far right is next Monday.
The purple finger on the lower left
is connected to the 81,404.4 dollar entry point yesterday, April 3.
Because it is touching the center line of the Bollinger Band 12-hour chart,
you need to hold on until 9 o'clock when additional candles are created to go up more.
*One-way long position strategy when the red finger moves
1. 83,568 dollar long position entry point / stop loss price when the green support line is broken
2. 86,871.5 dollar long position 1st target -> Top 2nd target
After that, target price in order.
If the strategy is successful, the 1st section that returns
You can use the long position re-entry section
The movement within the 1st section at the top and the 2nd section at the bottom is a sideways market.
If there is a crash in Nasdaq
It can drop below the bottom
And it can drop to 79.7K 3 times over the weekend, so please take note.
Up to this point, my analysis
Please just refer to and use it
I hope you operate safely with principle trading and stop loss prices.
You worked hard this week too.
Thank you.
BTC HTF ThoughtsChart from end of Dec/early Jan. Idea back then was that the top is in, and we'll revisit at least 51.5 levels. IMO low will be between 41.5-32.5, with potential to reach 23s.
However, it won't happen in one day and it's finally at prices i want to scale in and hold for the next weeks/months incase i'm wrong with the macro idea.
I'm a buyer between 74-62, levels in between are 72, 69, 65 and 62.

Bitcoin Poised for a Bullish Break? Eyes on Key Levels
- Key Insights: Bitcoin remains a focal point of interest with its notable
resilience amid recent market volatility. Analysts suggest Bitcoin is at a
critical juncture, and its ability to maintain support is crucial for future
momentum. This week presents an opportunity for traders to consider a long
position as Bitcoin navigates key support levels and potential breakouts.
Keeping an eye on broader market sentiments and Bitcoin’s divergence from
traditional assets, such as gold, may offer clues on price direction.
- Price Targets: For the upcoming week, traders looking at long positions might
consider these levels:
- Next week targets (T1) at $78,000 and (T2) at $82,500
- Stop levels (S1) at $73,500 and (S2) at $71,500
- Recent Performance: Bitcoin's recent market activity continues to display its
well-known volatility. Despite a broader market downturn, Bitcoin has
maintained a largely neutral to slightly bullish posture, closing last week
at levels suggesting stabilization. However, it remains under broader
downtrend pressures similar to gold, which has faced selling off despite its
technical uptrend status.
- Expert Analysis: Market experts emphasize the critical nature of Bitcoin's
current trajectory. With support levels monitored closely around $74,000,
Bitcoin’s path is seen as pivotal for dictating future trends. Its relative
resilience compared to other assets points to a potential resurgence in risk
appetite, though caution remains warranted as Bitcoin must uphold key
support to avoid bearish reversals.
- News Impact: One of the notable bullish indicators is MicroStrategy's
substantial acquisition of 22,000 bitcoins at an average price of $67,500,
revealing a positive sentiment among sectors despite existing volatility.
Additionally, technology stocks and crypto-linked equities are demonstrating
resilience amid broader market pressures, indicating a complex and nuanced
investor sentiment surrounding Bitcoin and related assets.
BTC Possible Trendmaster Scenario BTC Possible Trendmaster Scenario
Two Scenarios.
Good Market Buy zone.
Will buy more on yellow Scenario.
Bullish time will come soon

BTC CME Futures 84000A GAP is open between Friday's BTC CME Futures 84,000 and the current spot prices.
This GAP to be filled in the coming period.
I reckon a buy with a stop at 74,000.

BTC/USD 4H PAIR........Based on My provided information, My looking at a Bitcoin sell position with the following key points:
Sell Position: 83,000
Resistance: 84,000
Target Point 1: 78,000
Target Point 2: 75,000
This indicates that you're considering selling Bitcoin at 83,000 and targeting a drop to 78,000 or 75,000, with 84,000 acting as the resistance level. If Bitcoin fails to break the 84,000 resistance level, you expect the price to decline toward your target points.
If the price approaches 84,000, it would be important to monitor for any signs of a reversal, as that could signal a potential failure of your sell strategy. If the price reaches your target points (78,000 or 75,000), it could be time to consider locking in profits, depending on your risk tolerance.
Would you like assistance with analyzing this further or building a strategy around it?

Bitcoin Lost 50 SMA overnight, what next ? - still BULLISH.In a week where I am still expecting the beginnings of a bounce, we saw a Major Drop overnight.
This has pushed PA below the 50 SMA that I was hoping PA would bounce off, as it had previously.
So, Whats Next ?
It is not as bad as it may appear but CAUTION is a Very Very good idea.
There are a number of lines of support below and if we do not find any soon, 73K is the next line of Support. then down to 71K and ultimately, the long term line at 64K, though I still doubt we will get that low.
But FEAR is BIG...be a Vulture..Buy the remains of people Fear...Bitcoin IS a Scarce asset and people Still want it.
The Weekly MACD
The MACD is now in the bounce Zone. Yes, it may drop below neutral if this "Tariff Fear" continues. But Technically, We now have the ability to bounce once sentiment turns
On a slightly more bearish side is the fact that Histogram has dived deep and Red. The Bears are biting and has momentum
The RSI Relative Strength Index
Like the MACD, the RSI is now in an area where it has bounced in the past and yet, it can still drop further before we reach Neutral ( 30 line ) . It has to be said, the RSI is a bit behind the MACD in that it has a later date when it could reach Neutral. There is no guarantee that Neutral will hold RSI up....
Other Markets are struggling also
The DXY $ has had a sustained drop but is near an area of support. I am watching this closely.
Normaly, we see DXY and BTC move in opposite directions but we have seen both Recover at the same time, The lines between the teo are getting blurred.
GOLD - has been doing well for some omnths
However, in th elast 2 weeks, Gold has been selling off also and saw a steep drop towards the end of last week. Will be very interesting to see where this goes this week
The fact that Gold was selling, shows that investors were comfortable to leave a safe haven.
Lets see if that changes this weel
Conclusion for BITCOIN HOLDERS
This could all sound a little scary for Bitcoin and it should be taken as a HUGE Warning that we Lost the 50 SMA Support. This does open up the possibility of further drops and it may well happen
We are currently heading towards major support at 73K
This is an area I said we could hit a few weeks back and so I am not in a bad state of mind just yet.
If we Loose 71K, I will get uncomfortable.
The Lower timeframes are very much heading to OVERSOLD and so we shold get some support here and then we wait to see if Fear takes hold further.
This week, we Get the FOMC minutes and then Inflation data coming out of the USA
Thsi could Tip the balance either way, depending on the data
For me, I am NOT Selling Just yet.
I imagine many Short term holders will be and these coins will be snapped back up
We wait to see how today plays out
BUY THE DIP

Demand and FVGBTC is dropping it recently been in the news and because of the tariff venture and also there was supposedly recently social engineering attack. But if the FVG and Demand area don't stall BTC, we might see a return to the 60K region.

Best price for buy bitcoin =70.000 $Ready for a big bullish trend?
See the channel and pullback in weekly...
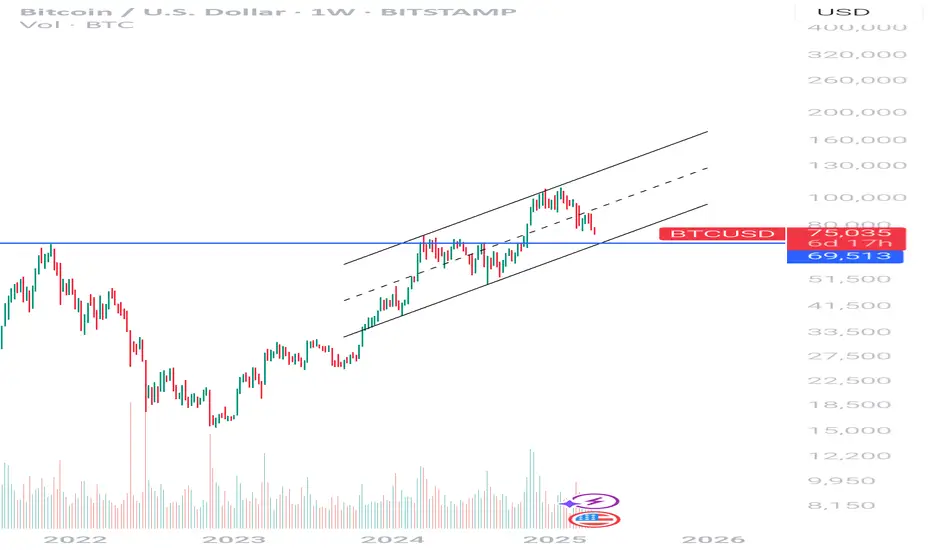
check the trendGiven the breakdown of the support trend line and the support area, it is expected that a diametric pattern will form. Accordingly, it is expected that a trend change will form within the specified support areas and we will witness the start of the upward trend.

BTCUSD.P, Binance Futures📆 BTCUSD.P – Weekly Technical Outlook (1W Timeframe)
🗓 April 7, 2025
🔻 Confirmed Breakdown on the Weekly Chart
Last week’s candle closed below the critical 82,117 – 85,084 USDT zone, signaling a potential medium-term trend reversal. The market currently trades around 75,000 USDT, with a weekly drop of more than 10%.
This break came with a spike in volume, increasing the probability of further downside unless a rapid recovery emerges.
📉 Key Weekly Support Levels:
🟦 74,000 – 75,000 USDT – current reaction zone
🔵 68,000 USDT – structure support with past demand
🔵 58,800 USDT – long-term ascending trendline since early 2023
📈 Upside Resistance Levels:
🔺 82,100 USDT
🔺 85,000 USDT
🔺 90,000 USDT – major weekly level; potential future retest zone.
🔍 Technical Notes:
Structure has shifted from bullish to corrective.
Weekly volume is rising → bearish momentum confirmed.
Price has detached from moving averages – early oversold signals may develop.
If 74,000 fails to hold, next structural target could be the long-term trendline near 58,800 USDT.
📌 What to Watch This Week:
Will buyers defend the 74,000 zone?
Any bounce likely to be short-lived unless followed by volume + structure confirmation.
Bearish pressure remains unless BTC reclaims the 82,000–85,000 zone convincingly.
⚠️ This analysis is for informational purposes only and does not constitute financial advice.

Bitcoin Sell to 73/72k ?There is a potential incoming sell on the 4 hour time frame.
Take profit around : 73/72 k
Stop loss: 85.6k
Pressure is the beer-goggles of tradingI took a loss over the weekend
Pressure can hurt your trading more than anything. Its the sober version of being drunk


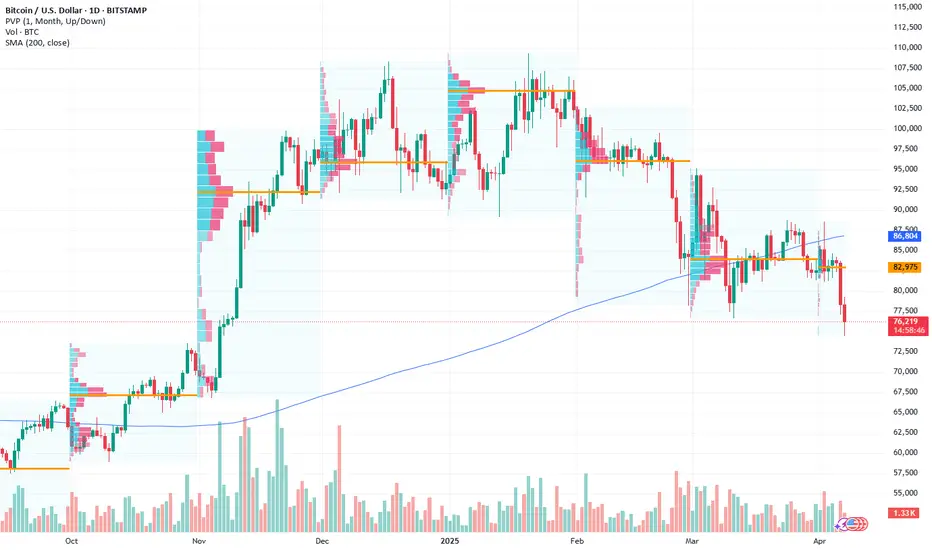
Bitcoin’s Doom: The Collapse Has Begun 50K comingBitcoin is on the verge of a catastrophic collapse, and the monthly chart confirms it. We have officially topped out, signaling the beginning of the 2025 bear market. The so-called “dumb money” is now holding onto their sinking bags, while the smart money has long since exited.
-RSI is trending downward, confirming exhaustion.
-The bull market is officially over.
-A steep decline to $50,000 and below is inevitable.
This is not just another correction—it’s the start of Bitcoin’s terminal decline. The dream of $100K has failed, and reality is setting in. As quantum computing advances and error rates decrease, Bitcoin’s encryption will be broken, rendering it obsolete and worthless.
The pet rock is sinking, and soon the crypto bubble will implode in spectacular fashion. The crash is not just coming—it’s already here.
Prepare for the reckoning. 🔥

Bitcoin is at a decision point.I would not be surprised if Bitcoin started correction waves from the Fibonacci 1.618 point.
RSI also looks weak.
Less likely, correction waves may begin after Fibonacci rises to 2.618 levels.
Harmonic patterns often target Fibonacci 1.618 levels.
Trump has had a major impact on the world economy and politics recently. This impact has also affected the crypto markets. Therefore, it makes sense to revise our analysis.
* What i share here is not an investment advice. Please do your own research before investing in any digital asset.
* Never take my personal opinions as investment advice, you may lose all your money.

Zone for a possible bounce from bitcoinProviding we get bullish divergences on the daily, 4 hr, 1 hr, and 30m RSI, we will be looking at this green box for a possible bounce. This looks like the bottom of a market maker cycle, looking for the price to come into the box forming the Peak formation low of the new cycle, recovering the imbalance from November, tapping into the Golden Pocket retracement from the previous range low to the all time high, and the bear market low to all time high .382 retracement.

btc fibonacci levels btc has broken the 76797 level 74901 if 76797 level does not hold we going to see a bounce off one these levels if you already been in a short lock in profits

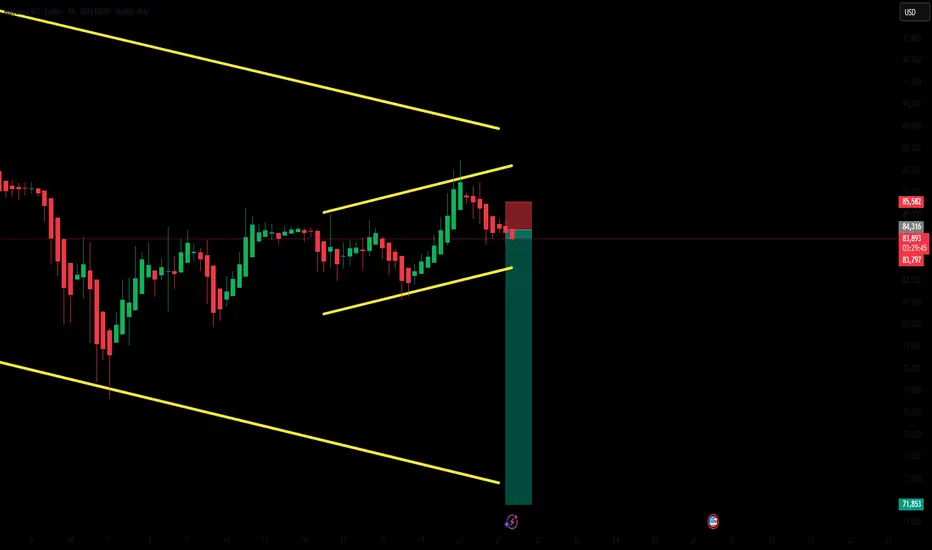
CAN BTC HOLD THIS PARRALELL CHANNEL??Bitcoin has been holding this parralell channel for quite awhile now.
So it's been very bearish with money flow and bearish diverging oscillator on high timeframes.. if it breaks below the channel it could surely be the bear market until next BTC halving!
