BTC CLOSES ABOVE 50 MABitcoin finally closed a strong daily candle well above the 50-day moving average – a notable technical development, especially since that moving average is beginning to curve upward again. It’s the first convincing close above the 50 MA in months, signaling a potential shift in short-term trend.
However, the move came on low volume – which tempers the enthusiasm. Without a surge in buying interest, this breakout could lack staying power. The 200-day moving average remains overhead as resistance, and the horizontal level at $88,804 is still the key barrier to flip market structure and print a higher high.
Encouraging – but not convincing – yet. Bulls need to follow through with strength.
BEARUSD trade ideas

BTCUSD 15mint Forecast Hello guys, I hop you are well let me tell you that BTC will go down to $86,200 right now and we can sell from here.


The Market Wins... For now... Let's talk CryptoIt seems that when I said in my previous videos "no matter what we want, Bitcoin can technically shoot up to a million tomorrow because that's just crypto", Crypto heard and said, "yeah, we'll do that". Kidding, we're not at a million nor will we be today or tomorrow. And at some point it will reverse because we need more demand for a sustainable push to new ATH's (peep 2021-2023 as I mention in this video). But at what point? Not for us to say until we start to see signs of tapering.
Once we broke out and consolidated out of our strong selling channel, we were given the heads up to be careful with our shorts - and with a certain amount of levels broken (i.e. FWB:88K ) I closed most of my short positions. But I do still have a HTF target at lower levels.
most importantly, we don't dictate to the market when it goes where. It decides on it's own and we wait for signals utilizing the algorithms and volume to guide us.
This is a long video because I don't have the "answers" as to why BTC is up 10%! But I still urge everyone to stay patient and cautious, either long or short, because in all markets there is clearly something being prepared for.
Happy Trading :)

Bullish rise?The Bitcoin (BTC/USD) is falling towards the pivot and could bounce to the 1st resistance which is slightly below the 61.8% Fibonacci retracement.
Pivot: 81,863.58
1st Support: 76,689.89
1st Resistance: 94,753.96
Risk Warning:
Trading Forex and CFDs carries a high level of risk to your capital and you should only trade with money you can afford to lose. Trading Forex and CFDs may not be suitable for all investors, so please ensure that you fully understand the risks involved and seek independent advice if necessary.
Disclaimer:
The above opinions given constitute general market commentary, and do not constitute the opinion or advice of IC Markets or any form of personal or investment advice.
Any opinions, news, research, analyses, prices, other information, or links to third-party sites contained on this website are provided on an "as-is" basis, are intended only to be informative, is not an advice nor a recommendation, nor research, or a record of our trading prices, or an offer of, or solicitation for a transaction in any financial instrument and thus should not be treated as such. The information provided does not involve any specific investment objectives, financial situation and needs of any specific person who may receive it. Please be aware, that past performance is not a reliable indicator of future performance and/or results. Past Performance or Forward-looking scenarios based upon the reasonable beliefs of the third-party provider are not a guarantee of future performance. Actual results may differ materially from those anticipated in forward-looking or past performance statements. IC Markets makes no representation or warranty and assumes no liability as to the accuracy or completeness of the information provided, nor any loss arising from any investment based on a recommendation, forecast or any information supplied by any third-party.

bitcoin longexhausted down trend
trump tarrifs
bullish momemtum building
use proper risk management
#forex #setup #strategy
Breakdown for week 16Hello traders,
Stunning pairs on watch for next week. Lot's of potential insurance entries to mitigate the risk.
FX:AUDCAD (LONG)
FX:EURNZD (SHORT)
FX:EURJPY (LONG)
FX:GBPAUD (SHORT)
FX:GBPNZD (SHORT
CRYPTO:BTCUSD (SHORT into LONG)

It's a trapThe break above the 200 SMA is hopeful for bulls, but it was not on high volume. My simple position trading strategy has not indicated to re-enter, it looks for both a cross of the 200 SMA and a cross on the MACD. The former has happened but the MACD crossed on the 12th and has stayed above since. It uses conservative values to avoid entering into bear market rallies. Trend reversal to the upside could be real, but the probability of a sucker's rally is greater.

#BTC Market Update – April 22, 2025Current Price: $90,700 (+4%)
📊 Technical Overview
• 200-Day MA: $88,356 – BTC is trading above it → Bullish sign
• RSI: 78 – Overbought zone → Possible pullback
• Resistance: $90,000 – Key psychological level
• Support: $85,000 – Watch this level on retracement
🔗 On-Chain Insight
• Long-Term Holders: Some distribution happening → Profit-taking
• Network Activity: Steady → Healthy usage
• Sentiment: Bullish → Weak USD + institutional inflows
🧭 Macro & Fundamentals
• U.S.–China tensions + Fed uncertainty → BTC seen as safe haven
• Institutions are increasing their exposure → Positive market signal
✅ Summary:
BTC shows strong bullish momentum, but RSI is overheated. Stay alert for potential short-term correction. Key levels: $85K support / $90K breakout.

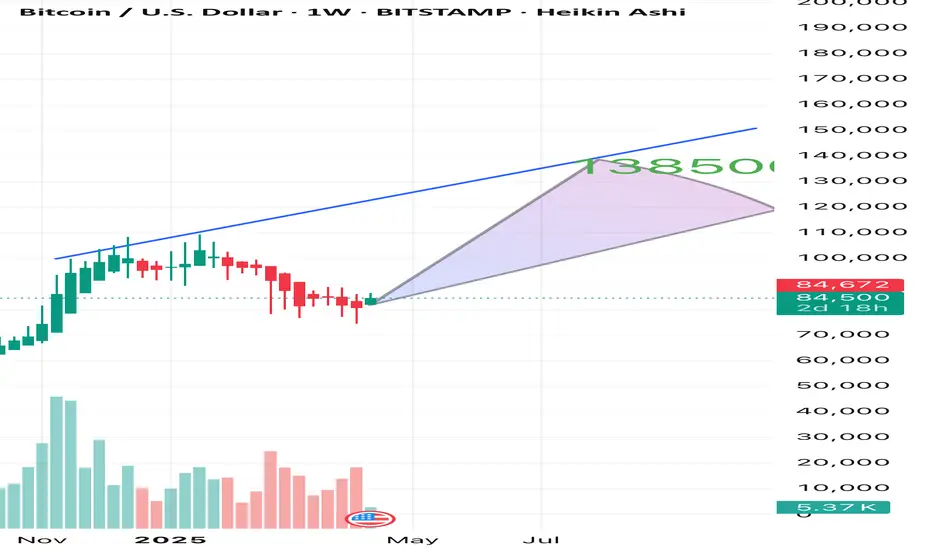
138500 next couple of week Bitcoin bullish now we will pump any time to soon in few months we will around 138500 area of resistance to test so this extra pumped
BTC/USD) breakout up trand analysis Read The ChaptianMr SMC Trading point update
bullish analysis of Bitcoin (BTC/USD) on the 4-hour timeframe, showing a potential breakout and rally scenario. breakdown:
---
1. Market Structure:
Downtrend Channel: Price has been moving within a falling channel.
Double Bottom Pattern: Marked by two green arrows — a bullish reversal signal.
Breakout Attempt: Price is testing the upper trendline and 200 EMA (~$83,952), suggesting possible breakout.
---
2. Key Zones:
FVG (Fair Value Gap): Around $78,678 — a demand zone where price could retest before moving higher.
Breakout Confirmation Zone: ~$85,130 — breaking above this with volume signals strength.
Target Point: $95,206 — an upside target projecting ~31.77% gain from the breakout.
---
3. Indicators:
200 EMA: Currently acting as resistance. Break above it confirms bullish momentum.
RSI: Around 60 — pointing upward with bullish divergence from recent lows, showing increasing buying pressure.
---
4. Scenarios:
Scenario 1 (Bullish Continuation):
Breaks above trendline and 200 EMA.
Retest (optional) and then heads toward $95,206 target.
Scenario 2 (Retest First):
Price dips into the FVG/demand zone.
Finds support and launches upwards, confirming a strong base.
Mr SMC Trading point
---
Summary of the Idea:
This is a buy setup on breakout or on pullback:
Aggressive Entry: Break and close above $85,130.
Safe Entry: Pullback into $78,678 area (FVG).
Target: $95,206
Risk Zone: Below $78,000 (invalidates bullish structure).
Pales support boost 🚀 analysis follow)

BTC has reached 88.5kBTC has reached 88.5k as per today, my target previously was 88k but I got out too soon at 86k (I got the weak hands syndrome for a bit, I blame the market its been too choppy)
So what do I see BTC doing next?
In all honesty BTC is looking very strong, I am sure the trend will continue but 88.5 has been a very strong point of resistance so I would say wait for the price to go over resistance before buying (this is my case) or wait for the price to retest the support and hold before buying.
Supports going down will be at around 86.7k and 85.1k The strongest support going down is the 83,5k I don't think it will go that low, but just in case it did and we don't see the huge red candles of death, then there is a chance that BTC will reverse and make it to the next resistances which are at around 95.2k and 109.3k
But one thing is for sure it makes no sense from a market maker's perspective to test low supports again because 88.5k will still be resistance again! So it makes more sense to just jump into 89-92k hold prices there and start going sideways there, so the alts can pump after.
Anyhow put stop loses up, do your diligence and don't trust any body else's advice not even mine, I can be wrong and I have been wrong, so let's not get rekt and enjoy the uptrends.

Big Pop Could Come Here Where we're most likely to be in the general trend structure now is fairly subjective. We came up off the butterfly support mentioned previous which is a great start for the bull move but we're also still well inside of bull trap territory.
If we have a low or a bull trap forming, should be a big spike here.

BTC/USD Long Setup – Bullish RSI DivergenceWe’re currently looking at a textbook bullish divergence on BTC/USD. While price printed a lower low, the RSI formed a higher low on the 4H chart, signaling a potential reversal in momentum. This divergence often precedes a trend change or at least a relief rally.

* 4/20 - BTC Elliot Wave Update *Hello again fellow gamlers!
Just a dropping a quick update before the beginning of this week!
Let me know what you think!

Volume smother by worlds best trader yashThis volume smoother helps us to know about volume Trend and bullishness or bearishness in char

A bit of extension According to my Fibonacci Extension, Bitcoin may climb to the 2.168 Fibonacci which is about 200k.

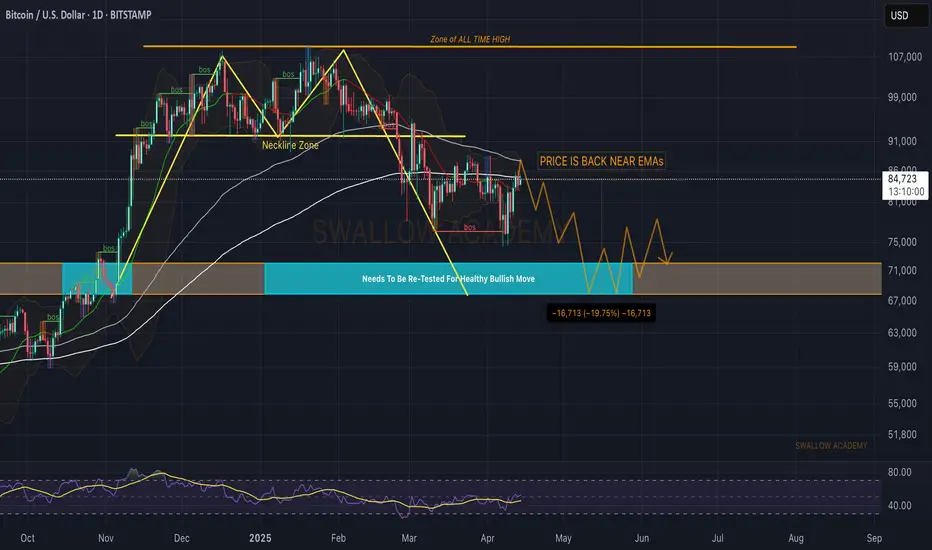
Bitcoin (BTC): Next Zone of Rejection Has Been Approached!After a strong dominance from buyers, the price has been led to our next zone of rejection, which stays between the neckline and the 100EMA line.
We are going to look for any signs of weakness near this zone from where we expect another wave of downward movement to happen, just like we had when we broke the neckline zone the first time!
Swallow Academy

Bitcoin (BTC): Back at 100&200 EMA Zone | Important AreaBitcoin is back at a branch of EMAs where we are now looking for the price action and how the market price will reach this zone.
Now, in previous times, we have seen a good rejection that has sent prices back to lower zones so that's what we are expecting to see once again.
Once we see a weakness near the EMAs, we are going to aim for a major support zone on bigger timeframes.
Swallow Academy
BTCUSDselling BTCUSD
sl 85700
tp 75849
1% risk on each trade
like an follow
short on btc/usd
NOTE: Like in life, risk management
is important if a forex trader wishes to survive.
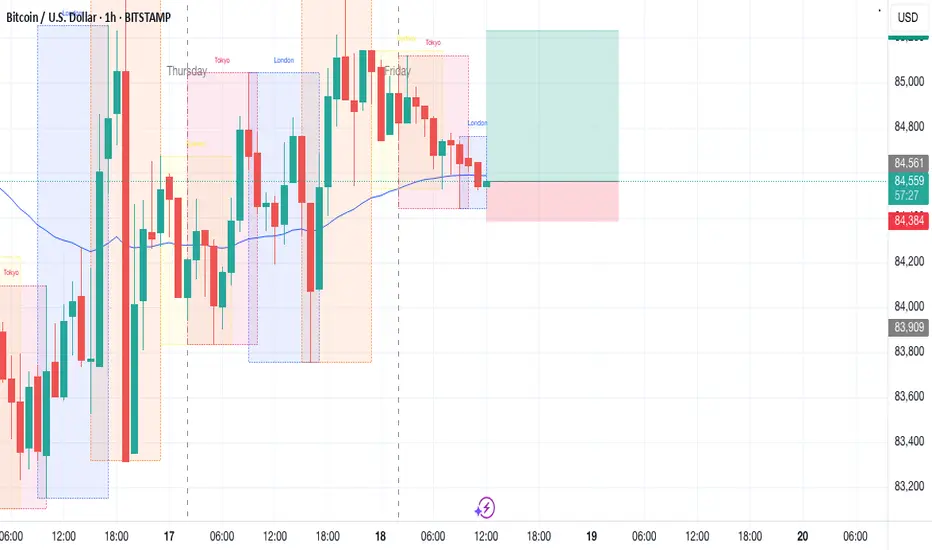
BITCOIN UPDATE: Time To Abandon Ship.The time to abandon Bitcoin ship has arrived at least for now. After watching Bitcoin spent the last 13hrs doing nothing and knowing that from this moment on it has like 7hrs left of its 1hr tf bullish cycle it is TIME to come out with the projection of its next the move.
Even if Bitcoin manages to breakout and go above the lower res line of $86500 it will be short lived cause the TIME it has left it is NOT enough to follow thru. Place your bets and Buckle up ladies and gentlemen brace yourself for the next wild....wild....wild ride.

BTC Potential Breakout, Daily DivergenceBTC on the daily has the opportunity to expand way upwards over the next month - a divergence on the daily evidently takes longer to play out but RSI could easily reach 80 off the back of the structure.
I have been shorting, confidently, for a good few weeks now, with longs in between, but I'm starting to feel like I should flip long.
Solana is also trying to reclaim the daily/weekly range - things to think about for sure.
Good luck out there!

BTC/USD..Bitcoin 1day chart pattern✨ ETHUSD Trade Setup
Technical Analysis: Ethereum (ETH) has broken out of the descending channel, signaling a potential trend reversal. The MACD is showing bullish momentum, supporting a Buy signal.
Entry: 1,600
Targets:
Target 1: 2,100
Target 2: 2,800
Stop Loss: 1,399
Bias: Bullish
Confirmation: Channel breakout + MACD bullish crossover
---
Let me know if you want a chart image, a version for social media, or to track this trade over time.
