BEARUSD trade ideas
BTC is trading within the equilibrium zone and..Bitcoin is now trading within my equilibrium zone. This will be one to watch for clues about the broader market, as it's currently leading the way.
Good luck, and always use a stop-loss!

Time for a reprieveObserve a 5 wave count for bitcoin and I will label it as wave (1). We will be seeing a wave (2) correction, bringing it down to the region of 82 K, as depicted in the chart.

Nice Run on BTC. Now we will have a pull back till next ThursdayThat was a nice pump on BTC, Rest in Peace to the Shorts.
BTC now will have a pull back to .5 Fib or .618 by next Thursday.
WE ARE IN A BULL MARKET, CHART SPEAKS FOR ITSELF. TRUMP DOES NOT CONTROL THE MARKET.
If you think Trump/Covid/any media coverage move the market, then you will be forever manipulated by the media.
The market is NOT manipulated. The people are, through the media.

Bitcoin short Elliott waves counts update Nothing much to say over here as I've already given analysis previously for Bitcoin. Just wave counts update.

Bitcoin Aligns with the 2017 Cycle ModelThere’s growing speculation that the current Bitcoin cycle mirrors the market behavior seen in 2017.
Intrigued by this, I conducted my own analysis. I overlaid the 2014–2017 cycle pattern onto the current chart for comparison.
The results?
A striking resemblance in both the overall shape and the distinct correction and impulse phases.
It seems history may not repeat itself exactly, but it certainly rhymes. 📊

Will XRP catch up with BTC and give us a 22% return?XRP has turned bullish after triggering an inverse head and shoulders pattern, suggesting prices could rise by up to 22 percent. Ripple now looks to catch up with Bitcoin and several altcoins that have already posted similar gains. Watch the video for full details and share your thoughts in the comments.
This content is not directed to residents of the EU or UK. Any opinions, news, research, analyses, prices or other information contained on this website is provided as general market commentary and does not constitute investment advice. ThinkMarkets will not accept liability for any loss or damage including, without limitation, to any loss of profit which may arise directly or indirectly from use of or reliance on such information.

Bitcoin hits $90K for first time since MarchBitcoin has climbed above the $90K level for the first time since early March. Is this an indication of risk appetite improving, or are investors buying Bitcoin for the same reason they are buying gold? In any case, as traders, we care about the HOWs and WHEREs more than the WHYs.
With that in mind, it is worth keeping an eye on the next areas of potential support and resistance to see whether Bitcoin will break them.
Initial resistance comes in the area between $90,000 to $91,900. In this range, you have prior support meeting the 50% retracement level of the downswing from the January high. Above this, the 61.8% Fibonacci level is at $96K.
Support levels to watch now include the $88,500-$88,800 area, which was resistance previously and where the 200-day average comes into play. Below that, you have the point of origin of this week's breakout near $85,000.
By Fawad Razaqzada, market analyst with FOREX.com

BTC: Bull Trap? Rally?Very interesting things are happening. From the 4-Hour chart to the 30-minute chart, although there are parallel patterns rising one after the other, none of them have worked yet. The price continues to rise despite the fact that Japan and Mexico have put the US on the brink regarding tariffs. We are experiencing one of the moments when classical technical analysis is helpless.
I say hold on tight when it starts to fall, the target may come up to 78,000. The Inverted Shoulder Head Shoulder on the daily is winking from the horizon, as if saying I don't recognize flag patterns.

Bitcoin - BTC vs ETHUsually, there will be a tight correlation between Ethereum and Bitcoin, especially during volatile periods like back in 2017 - 2018, 2020 etc... But as of recently, we have been seeing the correlation of ETH and BTC dissipated as the years has gone on leading me to believe that a major shift is inbound......
However, when studying price action in the short term, there is a possibility for BTC to draw to the upside, attacking the $86,847.

BTCUSD Short Setup – Bearish Reaction from Supply ZoneBTC recently broke out of an accumulation range, highlighted by the yellow box on the chart. Following the breakout, price surged and tapped into a nearby supply zone, showing signs of rejection. Current movement suggests a potential shift in momentum to the downside. We are currently monitoring a potential short setup on BTCUSD after price tapped into a clear supply zone around the 94,600 to 94,800 level.
Trade Idea Summary:
- Bias: Sell/Short
- Stop Loss: 95,000
- Take Profit: 88,830
- Risk to Reward Ratio: 1 to 2.57
Key Levels:
- High: 94,577
- Zone of interest: 94,600 – 94,800
- Support and target: 88,827
- Previous range low: 84,016
Notes:
This setup is based on a bearish reaction at the supply zone. A clean break of the 93,000 support level would provide further confirmation. Intraday volatility is high, so manage risk carefully.

Bitcoin Getting Ready To Bounce AgainLooking good....looking good. Bitcoin is setting up one last time to test and try to break res line of $87600 . Within the next 12 1hr candles (if not sooner) it should start moving UP. It would be nice to see it drop fast to get rid off all those Long stop loss in the GETTEX:82K area then bounce quickly to pick the power needed to go and break the $87600 res line. After that move is printed and tested the $87600 res line it will pullback and if it doesn't print a new lower low then the new Daily and Weekly uptrend direction will be confirmed. Buckle up ladies and gentlemen we are heading for another wild ride.

Risk-averse funds drive BTC higher.The sharp collapse of the DXY has triggered violent fluctuations in the global monetary system. As risk aversion heats up, investors are adjusting their asset allocations, with substantial capital flowing into "digital gold," which has enabled BTC to break last week's sideways consolidation and initiate an upward trend.
BTCUSD
buy@86500-87500
tp:88500-89500
I hope this strategy will be helpful to you.
When you find yourself in a difficult situation and at a loss in trading, don't face it alone. Please get in touch with me. I'm always ready to fight side by side with you, avoid risks, and embark on a new journey towards stable profits.

bitcoin for a buy 4hr time frame is uptrend after break of structure. We trigger our entry from lower time frame which is 15 minutes.
Conclusion:Bitcoin for a buy.

BITCOIN Free Signal! Sell!
Hello,Traders!
BITCOIN made a breakout
Of the long-term falling
Resistance line and then
Hit a horizontal resistance
Level of 88,860$ so we will
Be expecting a local pullback
From the level which means
We can enter a short trade
With the Take Profit of 85,297$
And the Stop Loss of 89,061$
Sell!
Comment and subscribe to help us grow!
Check out other forecasts below too!
Disclosure: I am part of Trade Nation's Influencer program and receive a monthly fee for using their TradingView charts in my analysis.

bitcoin buy longnew sentiment long, 3rd touch trendline
#forex
#bitcoin
#crypto
use proper risk management

BTC - Two Bullish Scenarios...Hello TradingView Family / Fellow Traders! This is Richard, also known as theSignalyst.
📉 BTC has been overall bearish, trading within the falling channel marked in red.
The $70,000 area is a key confluence zone — it aligns with the lower red trendline, horizontal support, a psychological round number, and a potential demand zone.
📚 According to my trading style:
As #BTC approaches the blue circle zone, I’ll be looking for bullish reversal setups — such as a double bottom pattern, trendline break, and more.
🏹In parallel, for the bulls to take over long-term, and shift the entire trend in their favor, a break above the last major high marked in red at $88,888 is needed!
📚 Reminder:
Always stick to your trading plan — entry, risk management, and trade management are key.
Good luck, and happy trading!
All Strategies Are Good, If Managed Properly!
~Rich

Bitcoin weekly buy signalI meant to share this earlier, but considering the current state of retail, it might not make much of a difference.
Bitcoin has recently formed a solid bottom on the Market Cipher B indicator. It's evident that price actions across all markets have been heavily manipulated. It's disheartening to witness Bitcoin being so tightly controlled. Liquidity seems to have been drained from every asset. The influence of market makers is pervasive across all assets.
Stay vigilant, Bitcoin should be on the move.

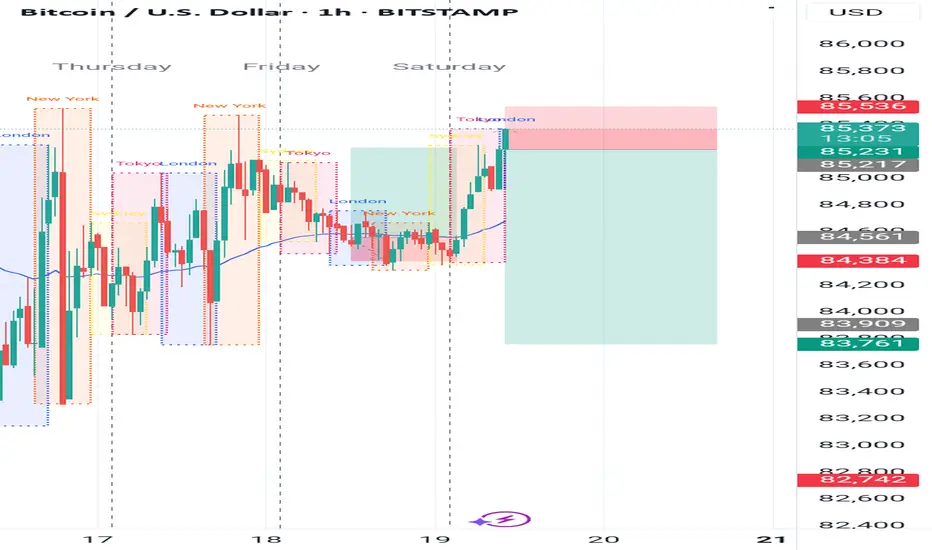
Bitcoin RSI Cooldown Before $88K? Key Support Levels to WatchBitcoin is showing strength towards the $88,000 mark, but the RSI on the 1-hour and 4-hour timeframes is significantly overbought, signaling the need for a healthy retracement.
I’m expecting CRYPTOCAP:BTC pullback to the RSI 50 midline, which could align with a price retrace to around $85,000–$83,000. If BTC loses the $85K level, FWB:83K comes next. A deeper retest could bring it back to $80K, which may serve as a high-conviction long zone.
Trading Plan:
Short scalp while RSI is overheated.
Long entries: $85,600 zone if structure holds.
Keep your eyes on volume and RSI reaction near key levels.

BTCUSD - Technical Structure Shows Bullish Continuation AheadBitcoin is currently showing signs of strength as it consolidates around the $85,000 level, with technical evidence suggesting a higher probability move to the upside. The chart depicts a recovery from the recent support zone (highlighted in blue) around $76,000-$77,000, with price action forming a series of higher lows since early April. While some short-term volatility may persist, the overall structure appears bullish as BTC continues to hold above the critical $85,000 horizontal level. Traders should watch for a potential pullback before the anticipated upward continuation, as suggested by the brief downward movement in the arrow pattern, which could offer an attractive entry opportunity before the next leg higher.
Disclosure: I am part of Trade Nation's Influencer program and receive a monthly fee for using their TradingView charts in my analysis.

BTC Approaches Breakout Zone in Ascending Triangle – Key Resist,📈 Chart Overview
Instrument: BTC/USD
Timeframe: Likely 4H or Daily
Indicators Used:
EMA 50 (Red) – 84,924.30
EMA 200 (Blue) – 85,558.47
🔍 Key Technical Observations
1. Ascending Triangle Formation
The chart shows a clear ascending triangle, a bullish continuation pattern.
Flat resistance zone: Around $88,700–$89,000.
Higher lows forming a solid upward sloping trendline, suggesting increasing buying pressure.
2. Price Above Key EMAs
Current price: $88,779.43, which is above both the 50 EMA and 200 EMA.
This indicates bullish momentum as price breaks above dynamic resistance levels.
3. Volume Consideration (Missing)
While volume is not visible on the chart, an ideal breakout from an ascending triangle should be accompanied by increasing volume to confirm validity.
🔄 Possible Scenarios
✅ Bullish Breakout
A confirmed breakout above $89,000 with strong volume can lead to a measured move toward:
Target = Triangle height ≈ $13,000 → Potential target: $101,500 – $102,000
Next resistance levels to watch: $92,000, $95,000, and $100,000 psychological zone.
❌ Fakeout or Rejection
If BTC gets rejected at resistance, watch for:
Retest of support trendline (~$86,000).
EMA 50 and 200 as dynamic support around $84,900–$85,500.
Breakdown below the trendline may signal a short-term correction to $80,000–$82,500.
📊 Conclusion
BTC is at a crucial decision point. The ascending triangle suggests bullish potential, but a breakout confirmation is essential. Price is above both major EMAs, signaling strength, but a rejection from resistance could invite short-term bears.

BTC on the verge of another accumulation range breakoutMorning all! So its time for a proper set of markups having spent the last few months breaking down the charts in video format for you all.
The last BTC update I gave was on 24/03, in the 4 year cycle analysis breakdown. In that video i was expecting lower pricing into SSL and the range lows once more, forming a bottoming structure before seeing a HTF bullish reversal come through, aligning with the 4 year cycle where we have time to continue higher based on past cycle data and where we are in the current cycle.
A month later and we have seen that come through wonderfully after the sweep of the range lows and its time to reanalyse now the direction is changing....
BTC has formed another accumulation range down in these discounted levels over the last couple months and there was nothing really interesting taking shape until the last couple of days thats give us some real confirmation of a trend change in this accumulation range that we can now work with. Unlike the August 2024 bottom, there isnt a massive influx of volume on the sweep event. I was able to call the bottom after such a sweep and high volume event back then just days after but in this most recent range we havent seen volume like back in August 2024, so ive had to be more cautious of further downside until we get some market shift confirmations to confirm intent and be on the safer side here whilst still holding my HTF bias of new ATHs before cycle end.
As shown on the charts, ive marked up the range and stages. We have carried out the sellers climax event, forming the range low, into the automatic rally (AR) forming the range high, moving into the secondary test (ST) with a failure swing back to the lows which forms the secondary test in phase B. From there we continued to range before putting in another range low deviation in the Spring event, with tests of the range low before seeing this explosive move come through from the spring event back to the range highs.
Volume also supports price action with a high influx of volume on the sellers climax low, stopping the prior trend, decreasing volume in the range into supply with a further increase in buyer volume as we deviate the lows in the spring event.
We have also broke structure bullish in the range and formed a HH, with a HL yet to be formed....
**So whats next? **
It seems a lot more clear now after the last couple days, and also confirms intent behind the range and i think its safe to say we have formed a bottom here and my focus is now on the upside on BTC from here. After this range high deviation into supply, in this new HH, i wouldn't be surprised to see BTC pull back to the midpoint of the range between $84,000 - $76,500, back into demand and form a last point of support/demand in the accumulation range forming a HL, before another leg higher as shown.
With how price has set up, with the demand left behind in the range and the bullish intent, my focus is on BTC forming a HL from demand before a continuation higher in line with my HTF bias that we will see new ATHs again before the cycle end. This is also supported in what im seeing on USDT.D and USDC.D where they are distributing in their ranges in supply with breakdowns in both and moving to a bearish trend.
Therefore, when price corrects into these levels i will be looking to allocate risk into the market during the discount of the HL and I will be looking for my buys on DOGE and any other opportunities, where im expecting higher lows in the market before continuations higher across the board. This doesnt mean everything though as many alts are yet to catch up and flip bullish, so my focus will be on the higher quality, stronger coins such as DOGE, but i expect the rest of the market to catch up eventually as BTC runs higher from these lows.
1D:
3D:
1W:
1M:

BTC Short from 93950Officially short BTC
via BTCZ
I think we might pop a bit more to 94400 in the morning but this should be it
I repositioned the fork so it touches previous highs (red arrows)
