CHECK BTCUSD ANALYSIS SIGNAL UPDATE > GO AND READ THE CAPTAINBaddy dears friends 👋🏼
(BTCUSD) trading signals technical analysis satup👇🏼
I think now (BTCUSD) ready for(BUY)trade ( BTCUSD) BUY zone
( TRADE SATUP) 👇🏼
ENTRY POINT (84400) to (84300) 📊
FIRST TP (84800)📊
2ND TARGET (85300)📊
LAST TARGET (85800) 📊
STOP LOOS (83800)❌
Tachincal analysis satup
Fallow risk management
BEARUSD trade ideas

BTC heads up at 95.2k: Covid Stimulus Fib should cause a DipBTC has been running nicely with risk-on sentiment.
Nearing a significant Covid fib at 95,176.28 (Coinbase).
Covid Stimulus nodes resonate most with monetary policy.
It is PROBABLE that we Orbit it a few times.
It is POSSIBLE that we get Rejected completely.
It is PLAUSIBLE to blow through it then come back.
If EXACT Rejection, look to sister fib below at $89,592.30
If ORBIT Capture, look to get flung in either direction.
If BREAK Easily, pay more attention to the Genesis fibs .
.
The other major fib series for BTC, the "Genesis Sequence":
These two sequences, the Genesis and Covid fibs, helped call "the TOP":
They also called the dip/bounce at 75k:
==============================================================

BTC must go to test $69K support before go to $140KI think you need to imagine the monthly chart, however it is all time high trend, but I think the BTC will need to go crash again to the $69 NYSE:K , since the RSI is over bought, and the Vwap is far from the actual price, the price needs to go touch the Vwap sooner or later, just remember that.
then we will see $140K

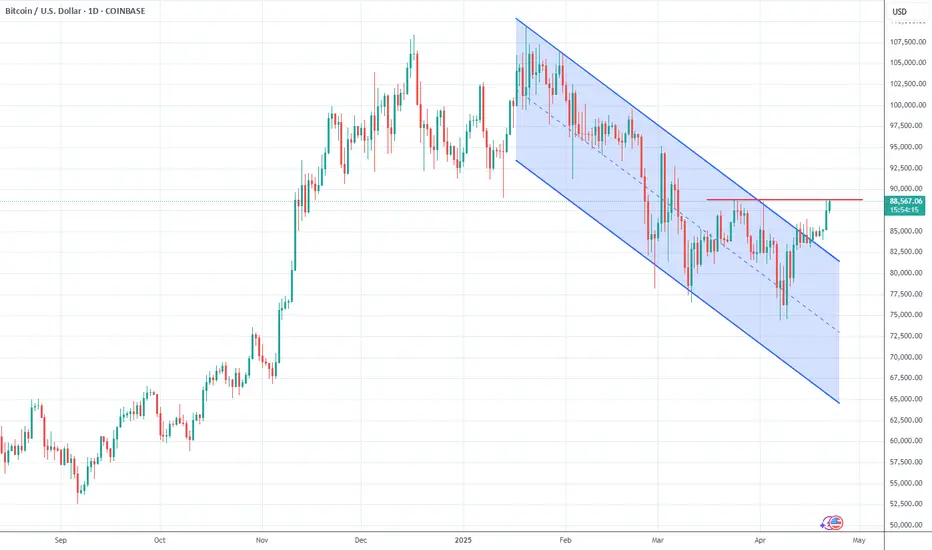
BTC BREAKS BULLISHBitcoin has officially left the chat... and the downtrend.
We’ve broken through the descending resistance from the all-time high with conviction, and cleared the key $88,804 level that had marked every failed rally for the past few months. Not only that – price has exploded above both the 50-day and 200-day moving averages, reclaiming them as support.
The breakout came with strong volume, validating the move. This is also a confirmed higher high, flipping market structure back to bullish for the first time since the March top.
Of course, nothing moves in a straight line, and some consolidation or retest wouldn’t be surprising. But this is exactly the kind of clean breakout technical traders look for – a textbook trend reversal.

$BTC Is Bullish Again — Momentum Building?Bitcoin ( BITSTAMP:BTCUSD ) is back with bullish momentum — and the charts are starting to show real strength.
🟢 Key bullish signals:
• Breakout above recent bearish channel resistance on daily chart
• Strong volume confirmation
🧠 Sentiment is shifting — fear is cooling off slighthly, and traders are eyeing higher targets.
📍 What I'm watching next:
• FWB:88K level is double top pattern neckline. Or there is a possibility that the price would bounce from the level and make another try to break it while forming head and shoulder pattern. We will see. But either way the level acts as neckline and the break would confirm a bullish move.
But let’s not forget: CPI data & macro events can still shake the market short term. Stay sharp.
Are you riding the wave or waiting for a retest?
Let me know your game plan below 👇
BTC Followed Our Plan As UsualBTC as usual followed our plan so perfectly. In MINDS also i reminded everyone about this move. Now can book nice profits here and stay tuned for our next Update

BTCUSD: Bulls Are Winning! Long!
My dear friends,
Today we will analyse BTCUSD together☺️
The recent price action suggests a shift in mid-term momentum. A break above the current local range around 84,334.50 will confirm the new direction upwards with the target being the next key level of 84,988.36 and a reconvened placement of a stop-loss beyond the range.
❤️Sending you lots of Love and Hugs❤️

Bitcoin on 'Pause' for brief moment!Seems like Bitcoin is making its moves in bullish fashion and is now exiting from the pause phase . Let me break down those phases for you: Consolidation, Bull, Pause, Bull...
On the chart, I’ve highlighted these phases:
Consolidation Phase: This is represented by a channel pattern , where the price moves within a defined range.
Bull Phase: This is the parabolic movement , showing strong upward momentum.
Pause Phase: This takes the shape of a triangle , signaling a temporary slowdown before the next move.
What’s fascinating is that all these patterns — channel, parabolic, and triangle shapes —have unfolded during the 2023–2024 bull run . Together, they form a rising channel , reinforcing the broader bullish structure.
Let’s see where Bitcoin heads next! 🚀

UPDATE ON BTC ANALYSISBTC/USD 1D - Well as you can see price has played out exactly as we predicted yesterday providing us with an amazing push to the upside. I do however want to see price correct itself before the next push up.
I have gone ahead and marked out the order block I have in mind that I would like to see price come and clear before it continues in this hawkish way. I feel this could be a great area to get involved in those longs from.
As we know there are some great prospects for BTC so its important that we are always looking for key areas of interest for us to buy in from with this market being a bullish one.
I will keep you all posted on how this market places out over the coming days, but a big well done to anyone who may have taken advantage of the last post on this pair and profited!

Bitcoin AnalysisBitcoin is currently moving within a defined price channel, and at the moment, it is trading near the top (resistance) of the channel.
This area often acts as a supply zone, where sellers tend to step in. Therefore, it may be a good opportunity to consider a short position, especially if it's supported by confirmation signals like divergence, reversal candlestick patterns, or other technical resistances.
As always, don’t forget to apply proper risk management, set your Take Profit levels, and consider Risk-Free strategies in case the market turns unexpectedly — especially in the high-volatility crypto environment.

bitcoin short sellbearish
lowers lows
momentum downwards
#crypto
#forex
# bitcoin
use proper risk management

People Used To Get Scared - BTC / USDMorning folks,
Read the chart, it contains all information.
I figured since I didn't update my inverted Adam & Even pattern chart much I'd just create a new one, but check it out, its playing marvelously.
Trade thirsty!

Mastering Volatile Markets: Liquidity Makes or Breaks Trades█ Mastering Volatile Markets Part 2: Why Liquidity Makes or Breaks Your Trades
If you've read the first part of this four-part series, you know that reducing position size is a key strategy for surviving volatile markets. The second crucial factor that determines success or failure in wild markets is understanding liquidity.
In volatile markets, liquidity is often the real reason behind those massive price spikes — whether 300-500 point moves in the NAS100, violent whipsaws in crypto or stop hunts in forex.
█ Liquidity: The Silent Killer in Wild Markets
In normal market conditions, liquidity is everywhere. You can enter and exit trades with minimal slippage, and everything feels smooth. But in volatile conditions, liquidity can disappear quickly.
Here's why it happens:
Market makers pull back to avoid getting caught in wild moves.
Spreads widen , making execution harder.
Order books thin out , meaning there aren't enough buy or sell orders to absorb aggressive price movements.
Even small orders can cause significant price changes when liquidity is low.
This is what causes those huge candles you often see in volatile markets. It's not just about more buyers or sellers; it's about less liquidity available to absorb those trades.
There’s also a common misunderstanding at play here: High Volume = High Liquidity
Many newer traders see a big volume candle and think, "Oh, high volume means it's safe to trade." But that’s an inaccurate conclusion.
⚪ Volume refers to the number of transactions happening.
⚪ Liquidity refers to how much depth the market has to handle those transactions without causing price instability.
In volatile markets, high volume doesn't mean there's enough liquidity.
And low liquidity causes wild wicks, huge spreads, higher slippage and unstable price action.
█ How to Navigate Low Liquidity in Volatile Markets
So, how can you trade effectively in these conditions?
1) Expect Crazy Moves — Levels Will Get Violated
In high-volatility, low-liquidity markets:
Support and resistance levels won't hold as they usually do.
Price will blow through key levels like they were nothing.
Fakeouts become extremely common.
2) Don't Rely Solely on Support & Resistance
As a newer trader, it's vital not to blindly rely on S/R levels in these markets. Here's why:
Don't expect clean bounces or perfect reactions.
Fakeouts, wicks, and stop hunts are normal.
Tight stops right behind these levels? You'll get stopped out a lot.
Experienced traders know this, which is why we adapt the strategies to handle the market's unpredictability.
3) Split Your Orders Into Smaller Chunks
One of the most effective techniques in volatile markets is order splitting.
Break it into smaller chunks instead of entering your full position at one price. This would help you survive fakeouts, scale in better across larger price moves and avoid becoming liquidity for bigger players.
Example: Let's say you want to go long at support (15,000 on the NAS100), instead of entering all at 15,000. Instead Enter:
25% at 15,000
25% at 14,950
25% at 14,900
25% at 14,850
This way, if the market fakes out below support due to low liquidity, you get filled at better prices without panic.
4) Control Your Emotions — Understand the Environment
This is HUGE in volatile markets.
Many retail traders panic when prices move against them quickly. But if you understand the nature of low liquidity , you can remain calm:
It's normal for the price to move wildly.
Levels will get swept.
Fake moves are common before the market plays out the right way.
█ Summary
Let’s take stock of what we learned today about liquidity in highly volatile markets:
High volatility often equals low liquidity.
High volume does not equal high liquidity.
Expect fakeouts , wild price behavior, and wide spreads.
Don't rely blindly on support/resistance levels.
Split your orders into smaller chunks to manage risk.
Trade smaller position sizes and stay calm.
Remember, you must adapt not only your size but also your execution . Understand liquidity, or it will punish you.
█ What We Covered Already:
Part 1: Reduce Position Size
Part 2: Liquidity Makes or Breaks Trades
█ What's Coming Next in the Series:
Part 3: Patience Over FOMO
Part 4: Trend Is Your Best Friend
-----------------
Disclaimer
The content provided in my scripts, indicators, ideas, algorithms, and systems is for educational and informational purposes only. It does not constitute financial advice, investment recommendations, or a solicitation to buy or sell any financial instruments. I will not accept liability for any loss or damage, including without limitation any loss of profit, which may arise directly or indirectly from the use of or reliance on such information.
All investments involve risk, and the past performance of a security, industry, sector, market, financial product, trading strategy, backtest, or individual's trading does not guarantee future results or returns. Investors are fully responsible for any investment decisions they make. Such decisions should be based solely on an evaluation of their financial circumstances, investment objectives, risk tolerance, and liquidity needs.

Bitcoin: Anything Goes Inside The Range.Bitcoin has rallied out of my anticipated 76K AREA reversal zone (see my previous week's analysis). I anticipated this move BEFORE all of the news and drama that transpired over the week because I focus on relevant information that came from this chart. As of now, price is fluctuating in the middle of a consolidation. While price is still attractive in terms of the bigger picture for investment, the fact that it is in the middle of a short term consolidation must be strongly considered for day and swing trade strategies. Here's my perspective.
A double bottom (failed low) has been established around the 74 to 76K area. It does NOT matter why, all that matters is the structure is now in place. This is very important for two specific reasons: 1) it is a broader higher low (Wave 4 bottom?) which implies a higher high or at least test of high is more likely to follow. This means test of 109K over the coming months is within reason. 2) Resistance levels have a greater chance of breaking while supports have a greater chance of being maintained. Current prices up into the 90K resistance are attractive for dollar cost averaging while broader risk can be measured by the 76K area low.
As for swing trades, price is fluctuating at a mid point of a consolidation. The range low is around 76K, the high around 88K (see arrow). When it comes to smaller time frame strategies, consolidation mid points are HIGHLY random areas. This is where you either WAIT it out for a support or resistance to be reached before taking a signal OR go with continuation patterns (Trade Scanner Pro great for this). The higher probability scenario would be a minor retrace into the high 70Ks or low 80Ks for a swing trade long. Otherwise WAIT for the 88K to 90K resistance area for short signals which would be EXTREMELY aggressive given the fact Bitcoin is generally bullish.
And day trades strategies have a similar outlook. Being in the middle of the range means smaller time frame supports and resistances within the area 83K to 88K are going to be less reliable or more random until price momentum asserts itself on the bigger picture. Beginners should simply avoid this environment, but if you must participate, the best way to adjust is work on smaller time frames like 5 minute or less and accept the whatever the R:R ratio is for that time frame. Either way do NOT expect BIG moves until price makes its way to one of the outer boundaries of the range. The Trade Scanner Pro quantifies the R:R for your chosen time frame and gives you a much better idea of what to expect.
The illustration on the chart points to a short term rejection of the 88K to 90K area resistance. This can be attractive for those who are willing to accept greater risk and operate on smaller time frames. IF Bitcoin breaks 90K, it can easily squeeze into the 95K area and all it takes is an unexpected news announcement which seems to happen regularly in this environment. NO ONE knows where the market is going, we can only assign probabilities which is why RISK must be assessed and RESPECTED before ANYTHING else.
This game is hard not because traders lack intelligence, it is because MOST participants believe they are consuming information that is relevant, especially if this behavior has been reinforced by random wins. As retail traders we have to operate with a blind fold while a small minority of participants operate with HIGH quality information. Here's a hint: you will not find truly relevant information on public platforms like Twitter, mainstream news, etc., yet people still turn to these sources when they feel the need to be "informed". Everything you NEED is on your chart.
Thank you for considering my analysis and perspective.

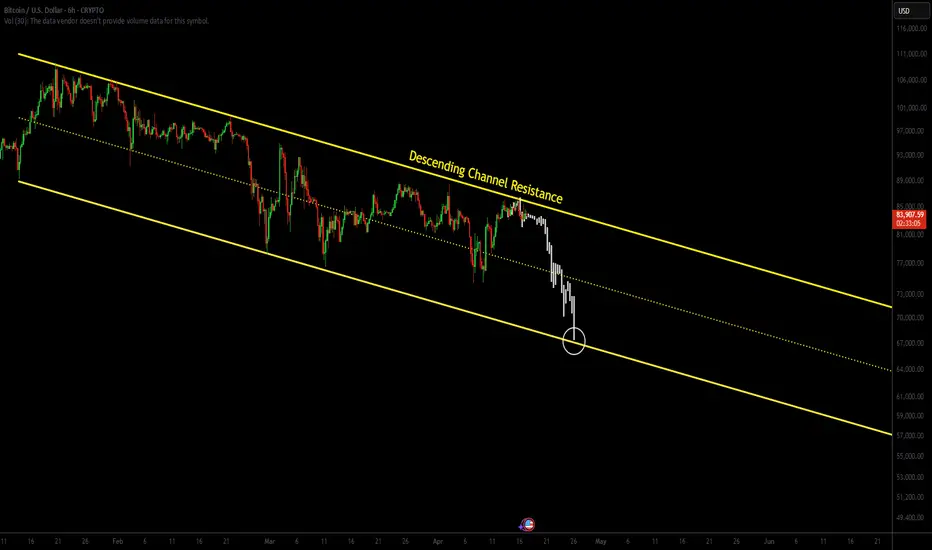
Bitcoin Pressing Against Descending Channel ResistanceIn today’s analysis, we examine Bitcoin’s price action as it continues to respect a descending channel pattern. With current price consolidating at the upper boundary of this channel, traders are now questioning whether BTC will break out or reject and rotate lower.
Key Points Covered in This Article:
- Bitcoin is currently consolidating at resistance of the descending channel
- A break of the recent swing low could lead to a drop to $67,400 support
- Confirmation of bullish breakout requires volume-backed move above channel resistance
Bitcoin is currently pressing into the top boundary of a descending channel, where resistance is holding firm. On the lower time frame, price action has entered a period of consolidation — a key sign of indecision. However, from a structural point of view, resistance remains resistance until broken. A failure to break through the upper boundary could accelerate downside momentum.
Should the current swing low be breached, traders can expect a move toward the lower boundary of this descending channel, situated around $67,400. This level will act as the next significant support, and it may provide a potential entry for reversal plays, depending on how price behaves upon reaching it.
For bullish continuation to occur, Bitcoin must decisively break above the descending channel with strong volume confirmation. Without this signal, any moves to the upside may be short-lived and potentially lead to liquidity grabs before another rotation lower. Traders should stay patient and wait for either a clear breakout or confirmation of further downside before entering positions.
BTC Bitcoin Trade plan 24/4/2025BTC/USD Trading Outlook:
Key Resistance Levels: $95,000 and $97,000
Channel Support Level: $92,000
Support Zone: $86,000
Market Scenarios:
Bearish Scenario:
If BTC fails to break above the resistance at $95,000–$97,000 and drops below the $92,000 channel support, it could trigger a sell-off.
Sell Targets:
Target 1: $90,000
Target 2: $88,000
Watch for further support around $86,000.
Bullish Scenario:
If BTC holds above $92,000 and breaks through the $95,000–$97,000 resistance zone, it may resume its upward trend.
Buy Target: $97,000 (with potential to extend higher if momentum continues)

BTCUSD next move(expecting a bearish move)(16-04-2025)Go through the analysis carefully, and do trade accordingly.
Anup 'BIAS for BTCUSD (16-04-2025) (MID TERM)
Current price- 83,800
wait for the break-out
"if Price stay below 85,800 then next target is 81800, 79,800 and 76000 above that 88,000.
-POSSIBILITY-1
Wait (as geopolitical situation are worsening )
-POSSIBILITY-2
Wait (as geopolitical situation are worsening)
Best of luck
Never risk 2% of principal to follow any position.
Support us by liking and sharing the post.

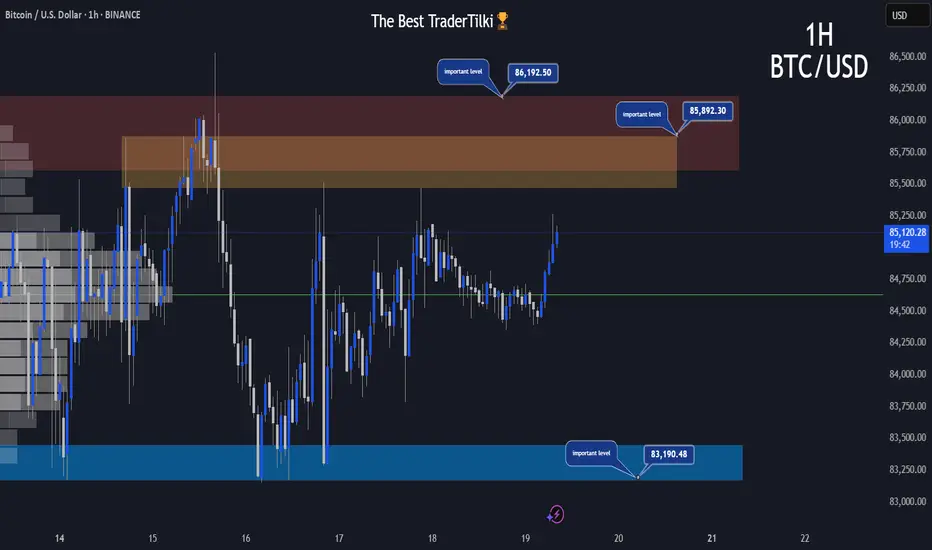
BTCUSD | 1H | IMPORTANT LEVELSHey There;
I’ve prepared a fresh Bitcoin analysis just for you.📈
Key resistance levels for Bitcoin are 85,892.00 and 86,192.00, while the support level stands at 83,190.00.⚠️
If Bitcoin breaks above the 86,192.00 level, the next target could be around 88,860.00.📣
I truly care about you all, and keeping you informed is something I see as my responsibility.🥰
Wishing you an amazing day ahead!💙
BTC/USD Price Action Update – April 22, 2025📊BTC/USD Price Action Update – April 22, 2025
🔹Current Price: 88,162.24
🔹Timeframe: 15M
📌Key Demand Zone (Support):
🟢88,157–88,460 – Clean Breaker Block (ideal for bullish re-entry on retest)
🟢85,500–86,500 – Higher Timeframe Demand Zone (strong base for major bullish leg)
📌Key Resistance Level:
🔴88,778 – Short-Term Structural High (key breakout point)
📈Bullish Outlook:
Price is consolidating below the 88,778 resistance. A clean candle break and close above this level can open the door to a bullish continuation, targeting the 89,500–90,000 range. Ideal entry on a pullback to 88,157–88,460 if demand holds.
📉Bearish Outlook:
If price fails to break and hold above 88,778, watch for signs of rejection. A bearish break below 88,157 could lead to a deeper retracement into the 85,500–86,500 zone.
⚡Trade Setup Tip:
✅Wait for a confirmed break and retest of 88,778
✅Watch price action at 88,157 for continuation or rejection
✅Use a tight SL and manage risk around news volatility
#BTCUSD #BitcoinTrading #CryptoPriceAction #SmartMoneyConcepts #BreakOfStructure #ForexAndCrypto #IntradayTrading #FXFOREVER #MarketUpdate #SupplyAndDemand #BitcoinUpdate

Bitcoin :: Daily chart Bitcoin ::: Daily Chart Buy setup- wait for breakout (91500 to 92500 )and buy

Bitcoin: The Grand Ascension Blueprint - Ready for Lift-Off!
The Most Important Bitcoin Chart You'll See This Year.. As we said before in pervious idea for enrty in 74,500
and that what happen in one month
Looking at this daily BTC/USD chart, we're witnessing the formation of a powerful technical setup that could define the rest of 2025. This isn't just another prediction—it's a strategic roadmap based on key technical levels that smart money is watching.
📊 What The Chart Is Revealing:
🔷 Perfect Channel Formation
* Bitcoin has established a massive ascending channel (gray boundaries) with textbook precision
* Current price ($77,626) testing the critical lower boundary support
* Previous touch points have all resulted in significant bounces
🔷 Triple Target Trajectory
* TP1: $82,400 - Initial relief target (conservative)
* TP2: $85,700 - Mid-channel equilibrium zone
* TP3: $89,100 - Upper resistance test before potential breakout
🔷 Historical Context Matters
* We're constructively holding above the December 2023 breakout level
* Current consolidation mirrors the pre-pump phase from late 2023
* Blue trendline break served as the first warning of trend change
Why This Pattern Has MASSIVE Implications
⚡ The Timing Effect:
The current position at channel support presents a rare low-risk, high-reward opportunity with clear invalidation points. The pattern suggests accumulation before a potential explosive move toward $130,000 by August-September.
⚡ Macro Alignment:
This technical setup coincides perfectly with post-halving supply dynamics and institutional capital flow patterns. The projected move higher follows the historical post-halving performance cycles.
⚡ Risk Management Precision:
* Invalidation point: Clear break below $74,000 with volume
* Ideal entry zone: $74,800-$75,500
* Risk:reward ratio at current levels: approximately 1:5
he Hidden Message Most Traders Are Missing
This isn't just about price targets—this formation suggests Bitcoin is preparing for its largest percentage gain phase of this cycle. The projected path (purple forecast line) indicates a potential 68% move from current levels in just 90-120 days.
Institutional positioning data supports this view. The methodical stair-stepping pattern in the forecast line suggests strategic accumulation phases between aggressive price advancement.
📊 SEE YOU AFTER 3-4 MONTHS .. FOLLOW ME FOR MORE DETAILS 📊

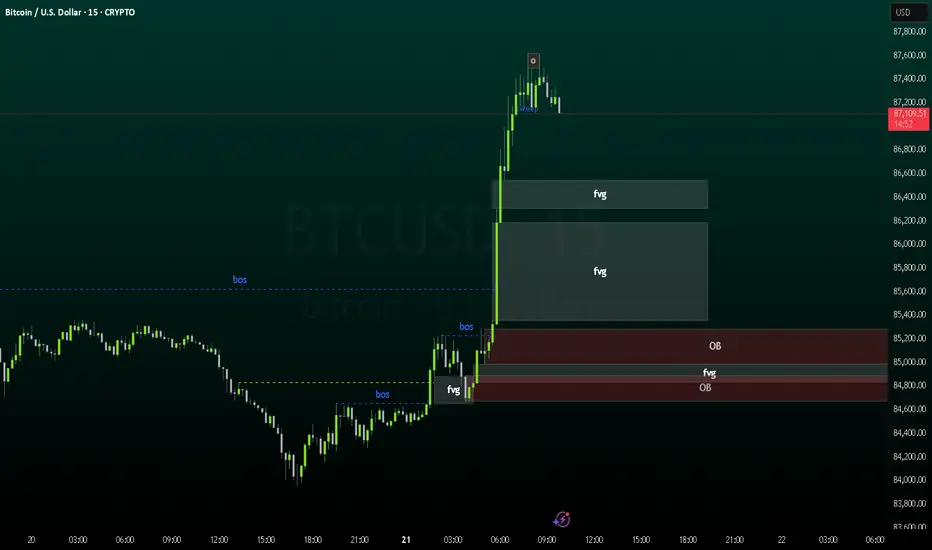
BTC USD buytradeBTC has broken structure to the upside, so I'm looking for a long trade in 15 minutes after the price reaches the FVG.
4 Analyses with 100% sensitivityBTCUSD - LTCUSD - ETHUSD - XRPUSD
I suggest that if you want to see the strongest price support in these 4 currencies, check out the analysis I posted for these currencies in the past months.
