DUOL trade ideas

Duolingo On Fire: Can It Keep Going Amidst Economic Uncertainty?Duolingo Inc (DUOL), an American edtech company, offers over 100 language courses, including popular and less commonly studied languages. The platform uses gamified lessons with translating, interactive exercises, quizzes, and stories to make learning more engaging. Its unique algorithm adapts to each learner's level and learning style for personalized feedback and recommendations. Duolingo also offers a language certification program, a literacy app for children, and a math app for iOS. The platform also offers podcasts with simplified grammar, vocabulary, and slower intonation for intermediate level learners. NASDAQ:DUOL is listed on NASDAQ.
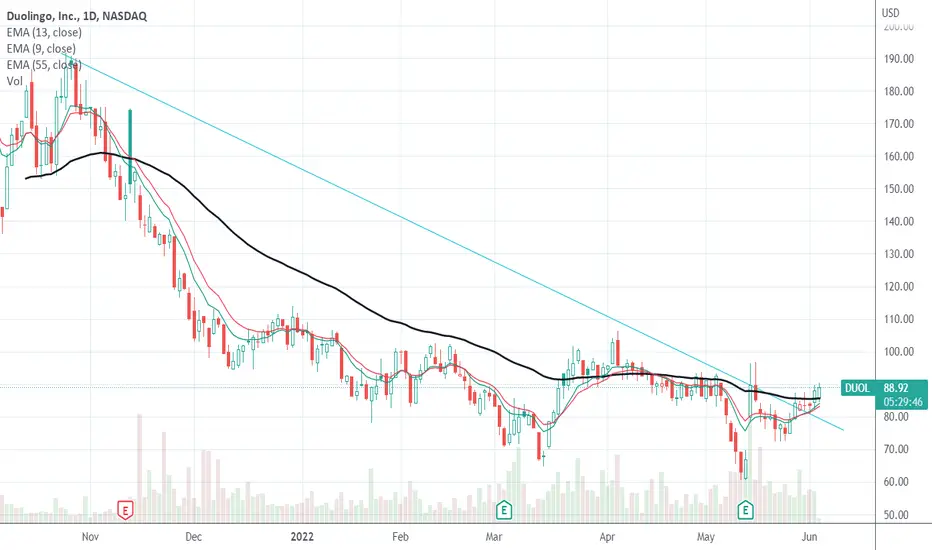
Wyckoff Change Of Character Leading Into Accumulation Phase And Breakout
DUOL has been in downtrend after hitting an all-time high of $205 on 22 Sep 2021. The Wyckoff distribution persisted until a Wyckoff selling climax (SC) on 15 March 2022 where it hit $64.80. The subsequent reaction was a relatively impulsive automatic rally to reach $101.50. This had the characteristics of Wyckoff change of character (CHoH) as the price structure shifted from downtrend to a trading range.
For the next few months, the price tested the highs and lows of the range. Several Wyckoff upthrust (UT) was formed but unable to commit above the resistance of $101.50. Yet the duration DUOL spent in the upper trading range $90-$110 showed evidence of strength.
The price did one last leg down to test the low in late October to December of 2022 with low volume suggested exhaustion of supply. At the beginning of 2023, DUOL price had a localized Wyckoff spring then started a significant Wyckoff sign of strength (SOS) rally. It was the best rally and the pull back from resistance was shallow, forming the Wyckoff last point of support (LPS). This is the sign before a successful breakout of the Wyckoff accumulation phase. With earning results as catalyst, the price gap up above the $101.50 resistance and committed above it. This was accompanied by increased volume hinting at the presence of demand. The up trend took a momentary Wyckoff back up (BU) pullback forming a higher low at $114 before continuing on the phase E uptrend.
Bias
Bullish. According to the Wyckoff method, DUOL has just broken out of the BU range of $130.50 and is overextended short-term. The price might retest this level and before challenging the next immediate resistance at $154 and $165.
If the price breaks below $130.50, it will likely retest the support at $114 with a prolonged consolidation.

DUOL out of base attemptDUOL found base for about 17 trading days following earnings and now looks to lift. 55ema makes sense.

DUOL - Duolingo, Inc (IDEA)Solid setup emerging as this stock has based all year long and has major signs of accumulation since its earnings report in mid-May as it forms the right side of a base. Volatility remains contracted near the breakout level, which is a big plus.
Potential entry trigger - break over last weeks highs.

DUOL Overview and Prediction
In the most recent two-quarters, DUOL has sold off ahead of earnings and then rebounded sharply after reporting earnings beats. Coming into this quarter price action is reversed. DUOL has experienced a strong rally from a quarter ago, clocking in over a 50% gain from the lows of their Q1 2022 earnings in May. This bullish short-term momentum might just be stomped out by this quarter's earnings.
The technical picture for DUOL is somewhat poor, especially in recent trading days. The support trend line has held nicely with three consecutive touches and rebounds. However, with a major event coming up (earnings on 8/4), DUOL may slide well below this support trend line and revisit support zones at/around 84.8, 75.4, and 66.55. The recent bull run makes me increasingly confident in this thesis, as earnings would have to be out of this world positive for any substantial upside gain in my opinion.
Fundamentally, DUOL appears weak. Simply put, Duolingo is overvalued and generates negative profits. There are way too many macroeconomic/geopolitical issues for tech and growth to perform well (at least for the coming 2-3 years). The idea that DUOL, an IPO with no earnings and expected revenue for this year at 267 mil should be valued anywhere near 4 billion dollars seems a bit foolish.
Duolingo's weak technical and fundamental health combined with an unprecedentedly problematic global macro picture prompt me to predict the following: It is a matter of time until this stock falls and eventually forms new lows. It may not be this quarter's earnings that trigger DUOl's stock to move lower, but it will happen eventually... unprofitable growth is the wrong place to be in this environment.
As always this is not meant to be trading advice. Good luck!

$DUOL Long into next week Nice rounded base and coming out of resistance zones with a strong +6% day - DUOL , science based learning platform.
I like the AUG 115/120 debit spreads as I still am weary of this market pulling the rug. However a lot of individual names are starting to look bullish breaking out of bases... like Duol :)
Cheers

US Stock In Play: $DUOL$DUOL - Technology | Software - Application
key for me in this general market weakness is to look for RS within sector -> name. technology is one of the top 3 performing sector over 2 weeks and $DUOL have displayed RS high YTD.
currently basing beneath IPO VWAP & 200D MA

DUOL Dump
DUOL is trading at a price to sales ratio of roughly 14. Duolingo is a prime example of one of the covid era IPO's and SPACs that trade on hype without any earnings or sign of profitability.
The technicals suggest more downside. I see a break below 93.5 support leading to a retest of current ATL at around 60.3, ultimately leading to another leg lower creating a new low at 50-45 a share.
This is not trading advice. These are just my thoughts on future price movement for DUOL.

$DUOL Double BottomRecent IPO $DUOL is presenting to us a classic double bottom pattern. Within the last couple of weeks, there has been strong volume around the support areas. The second bottom also undercuts the first bottom, which is a positive sign as well, as we want to see that shakeout occur.
Another thing is that earnings, subscriptions, and bookings are also showing signs of strong growth.
Now as for the downside, the company is still not profitable and is operating under a net loss. There is also an overhead supply from the Post-IPO volatile price action.
I would be looking to progressively scale in once it starts increasing in volume as it tries to break past the middle-high of the "W" pattern, around $106.

Dow Review (English subtitles)Click the "subscribe" necessarily if you come review! Then I will post more ideas.
My training and analysis chat Wyckoff Analitics look in the chats and subscribe
Friends I conduct training in individual format and a limited number of students, as a large number will interfere with my trading!
The course includes :
Wyckoff Method
Demark method
VSA
Trading method tailored to your psycho-type
Trading Psychology
For more details please contact me in a private message
I can also introduce you with my unique indicators, of my own design
Wykoff Zone (Defines activity and smart money zones and also gives buy and sell signals)
Indicator Demark, which has no analogues on the platform - as most of the indicators are far from the essence of the methodology of Demark and too simplified, which violates the basics of the principle of
For investors, I can transfer the 2 weeks course Lazy Investor on which you can learn how to invest and in what shares to invest + method of cross zeros
Completed with my own developments taking into account the imbalance of supply and demand
Indicator Wyckoff Line created by the activity of professionals and identification of liquidity zones, to which the price is attracted.
Remember that the market is only driven by supply and demand. No technical indicators will tell you in advance whether a supply or demand imbalance has occurred.
Listening to the news can put you in a state of wrong decision, so make decisions only by the activity zones of professionals. By understanding where the imbalance of supply and demand is occurring, you can correctly build your strategy of work.
The indicator has a clever algorithm that takes into account the activity zones on several timeframes above the working chart.
It also includes a system of VSA, which determines the entry point for buying or selling a certain instrument. The entry point is determined by the imbalance of volume and price on the principle of lack of demand, or lack of supply in liquid areas.
Take a look at "Figure 1", which clearly shows the supply test after which the price reached the next liquidity level in WMT stock
The following example clearly shows a buy after a downtrend, which after the passage of the liquidity zone defined a clear signal to buy the stock AAPL
The essence of the indicator is that high volume is always a liquidity zone, into which the price will constantly strive. The indicator determines the liquidity zones of the professionals, which you set on the higher timeframes with the help of certain settings of the high volume bar. And along with the indicator package I provide a tutorial video where I tell you how to use this indicator. I also give some author's settings and recommendations for entering or exiting a position.
Now let's analyze the sell signal. Here is an example of one of the sell signals in which the indicator clearly worked:
The price reached the liquidity zone and it signaled three times that it was time to enter the position. Next, using completely different entry techniques, you could sell the KO stock or, if you were trending upwards and your techniques did not involve selling, you could simply exit your position in time.
The uniqueness of the indicator is that it works on a chart like crosses zero. By setting liquidity zones, you can use the signal of this indicator to enter a position without any market noise. Take a look at the example below where an entry was made into an MSFT stock:
snapshot
To start using the indicator you need to write me a private message.
I will send you instructions for using the indicator and my recommendations (how to enter and exit a position) and indicator settings.
You can receive free support and advice from me during the whole time of using the indicator by writing me in personal messages.
Ability to use the indicator in different languages: I will provide you with a video guide for setting and instructions for use in your own language.
Available languages for using the indicator: Russian, English, Chinese, Spanish, German.
Translation of indicator settings into different languages is in progress.
Indicator subscription price is $20.
Indicator purchase for unlimited use is $300.

$DUOL >55ema, looking for DTL break $DUOL momo type earnings recently, v.popular app- one of the biggest earnings upward revisions,
47% rev growth, 55% bookings etc. Wouldnt be surprised if it caught on.
US Stock In Play: $DUOL$DUOL technology name, IPO 7 months ago.
rising 10/20 MA with bullish crossover after 6 months of decline. volume remains subtle as it continues to build a base beneath the highlighted DTL.
$102.55 is a clean pivot that would take this name out of its DTL, and YTD resistance

Duolingo & Monday.com - Stops TakenDuolingo & Monday.com - Stops Taken
You win, you lose, that's how it goes...it's called risk assets.
Original ideas attached.

Trade Setup: Long DuolingoDuolingo is an American language-learning website and mobile app, as well as a digital language proficiency assessment exam. The company uses a freemium model: the app and the website are accessible without charge, although Duolingo also offers a premium service for a fee.
Price through $183.00 pivot
Now trading $190.00.
Stop: $185.80
Target: $205.00

Duolingo Indicators Are Flashing RedAs an update, Duolingo appears to be testing the limits of its rising wedge pattern.
Mathematically speaking, when the price breaks out of this pattern, a 27.52% move is in store. If it happens soon, this would line up very well with where most analyst price targets are located ($145 range).
Other significant indicators are also becoming more bearish:
1. The RSI triangle is becoming narrower with a break to the downside likely.
2. The Chaikin Money Flow is showing that investment has been drying up for the last week. DUOL isn't dominated by insiders or institutional investors; the CMF decline represents retail losing confidence in elevated prices.
3. The MACD also had a death cross last Friday and is headed downward.
4. Not shown here, the Schaff Trend Cycle indicated Friday a "Sell Signal", meaning that a significant downturn is in the short-term.
The 3 white circles demonstrate where we should see trendline breaks if a correction were to begin early this week.

Duolingo has overshot any reasonable valuation.Although Duolingo only has a short price history, it appears that a dramatic pullback is ahead. The stock is in a rising wedge pattern (4 hr chart) most likely resulting in a 21.43% correction downward. The volume has been drying up drastically this week signaling the stock is too weak to break the $205 barrier. Analyst estimates hover around the $145 mark and most message board activity I have read supports the idea that retail investors also believe the stock is overvalued.
Importantly, Duolingo is a speculative, long-term tech play that depends on cheap access to capital to reach their financial goals (similar to TSLA), because interest rates are increasing so much in the last few days (10-year treasury up 12% in last 2 days alone), it seems probable that investors will rebalance their portfolios away from risky stocks like this one and take profits while the price is still at all-time-highs.
The RSI indicator is in a triangle formation while simultaneously showing bearish divergence; this pattern only has a few more days maximum before a break must occur and with the volume oscillator indicator showing volume deep in the net-outflow range, we can expect the price to break downward.
My strategy is to purchase Oct 15th $165 Puts and plan on selling these when we get closer to the $155 range. I would caution anyone else planning on doing the same though, Duolingo's volume is very low and the options chain has very little open interest, the liquidity of the market is not ideal.
