Potential KWEB accumulation range breakout36.25 is a key level to watch on a weekly closing basis.
Multiple weekly closes above this will signal a high probability markup campaign.
Long here, stop on weekly close below this high for the accumulation range
KWEB trade ideas

KWEB Pivot Point is NearAMEX:KWEB is near a decision point zone.
$37-40.50 are potential resistances.
Above 41 and the sky becomes clearer.

Chinese Internet Stocks on the Edge: KWEB vs. FXI Introduction:
The Chinese internet sector AMEX:KWEB is at a critical juncture when compared to large-cap Chinese stocks AMEX:FXI . The ratio between these two reflects sector leadership—if KWEB outperforms, it signals renewed strength in internet stocks and suggests the sector is leading.
Current Market Context:
Potential Breakdown: The KWEB-to-FXI ratio is teetering near key support. A breakdown here would be a bearish signal for Chinese internet stocks.
Bullish Outlook: However, bulls are closely watching for signs of outperformance from KWEB, which could indicate the start of a new bullish trend.
Higher-Low Formation: If the ratio forms a higher low relative to its long-term trend, it would be a sign of potential strength in the internet sector.
Key Levels to Watch:
Support: Monitor the ratio’s current support level closely. A breakdown below this could lead to increased selling pressure on KWEB.
Resistance: A breakout above recent highs would indicate renewed outperformance and signal a bullish rotation into internet stocks.
Conclusion:
KWEB is at a make-or-break point, and the coming days could determine its fate. If the sector can establish a higher low and break above resistance, it could signal a bullish shift for Chinese internet stocks. Will KWEB lead, or will large-cap Chinese stocks maintain their dominance? Let me know your thoughts in the comments!
Charts:
(Include a chart showing the KWEB-to-FXI ratio, marking key support, resistance, and any signs of higher-low formations.)
Tags: #KWEB #FXI #ChineseStocks #InternetSector #SectorLeadership #TechnicalAnalysis #MarketTrends #China

China’s Internet Revival?KraneShares CSI China Internet ETF is exhibiting strong bullish momentum, with a gap forming around the $27.00 level. A breakout above the $32.60 daily resistance would confirm further strength, positioning the ETF to target $46.19. This trade setup offers an excellent risk-to-reward ratio, with a stop-loss set at $24.82 to manage downside risk.
KWEB provides exposure to China’s leading internet and technology companies, which are poised for growth as the Chinese economy recovers and consumer demand strengthens. As regulatory pressures ease and innovation accelerates across key industries like e-commerce, digital finance, and cloud services, this ETF stands to benefit significantly.
For a deeper dive into this setup, check out my YouTube breakdown, where I analyze the technical trends and discuss the fundamentals driving this opportunity.
With its combination of technical momentum and favorable macroeconomic conditions, KWEB presents an attractive opportunity for traders and investors aiming for $46.19.
AMEX:KWEB

$KWEB - Good RRAMEX:KWEB descending wedge play. Ideal entry below $27 but current level presents a good risk-reward.
With China trades you would need to be ruthless in taking profit.
As always, I share my opinions and trades. I'm not suggesting that anyone follow my trades. You do you.

$KWEB - Would you bet?AMEX:KWEB Trendline has been hard to break. If it manages to break through it, we are looking at a measured move of $35. However, $32 to $33 area would be hard to break through.
It is showing some signs of a potential breakout, but you have to be quick in taking profit. China is hard to bet on.
As always, I share my opinions and trades. I'm not suggesting that anyone follow my trades. You do you.

KWEB BrewingAnother chinese name brewing a great setup
It needs to move quiet a bit before consider an entry, but I have my eyes on this pennat

textbook wycoff bottomspeaks for itself. Should find resistance at the 200WMA.... some consolidation is expected at these levels for a move higher.

$KWEB very bullish for now. Big cap China ETFKWEB montly vs Daily. Very bullish. Hard to get excited about unless they can hold the uptrend for a while.

Kraneshares China Internet ETF | KWEB | Long at $26.00The "beginnings" of a change in the downward trend of China's tech stock market may be starting to unfold. The price of Kraneshares China Internet ETF AMEX:KWEB has finally reconnected with my selected simple moving average (SMA) which often means further price consolidation or future price breakout from the overall mean. I'm not saying this will happen immediately and this particular SMA likes to be tested to "fake out" buyers and sellers (sometimes over months or years). Plus, there are price gaps in the low BER:20S on the daily chart that often get filled before a run. But for the early birds out there, like myself, AMEX:KWEB at $26.00 is in a personal buy zone as a starter position.
Target #1 = $30.00
Target #2 = $37.00
Target #3 = $49.00
Target #4 = $100.00 (very long-term view...)

Pullback in the China Internet ETFChinese stocks tried to break a multiyear funk in April. Now traders may see opportunity in their recent pullback.
Today’s chart focuses on the KraneShares CSI China Internet ETF AMEX:KWEB , which holds names like Alibaba NYSE:BABA .
The first pattern is the level around $28.80. It was a peak in October and November that gave way early last month. KWEB is now trying to stabilize in the same area. Has old resistance become new support?
Second, the price zone roughly corresponds to a 50 percent retracement of the rally between April 19 and May 17.
Third, the 50-day simple moving average (SMA) had a “golden cross” above the 200-day SMA last month.
Finally, stochastics have hit an oversold condition.
Standardized Performances for the ETF mentioned above:
KraneShares CSI China Internet (KWEB)
1-year: +17.03%
5-years: -27.56%
Since Inception: -14,42%
(As of May 31, 2024)
Performance data shown reflects past performance and is no guarantee of future performance. The information provided is not meant to predict or project the performance of a specific investment or investment strategy and current performance may be lower or higher than the performance data shown. Accordingly, this information should not be relied upon when making an investment decision.
TradeStation has, for decades, advanced the trading industry, providing access to stocks, options and futures. See our Overview for more.
Past performance, whether actual or indicated by historical tests of strategies, is no guarantee of future performance or success. There is a possibility that you may sustain a loss equal to or greater than your entire investment regardless of which asset class you trade (equities, options or futures); therefore, you should not invest or risk money that you cannot afford to lose. Online trading is not suitable for all investors. View the document titled Characteristics and Risks of Standardized Options at www.TradeStation.com . Before trading any asset class, customers must read the relevant risk disclosure statements on www.TradeStation.com . System access and trade placement and execution may be delayed or fail due to market volatility and volume, quote delays, system and software errors, Internet traffic, outages and other factors.
Securities and futures trading is offered to self-directed customers by TradeStation Securities, Inc., a broker-dealer registered with the Securities and Exchange Commission and a futures commission merchant licensed with the Commodity Futures Trading Commission). TradeStation Securities is a member of the Financial Industry Regulatory Authority, the National Futures Association, and a number of exchanges.
TradeStation Securities, Inc. and TradeStation Technologies, Inc. are each wholly owned subsidiaries of TradeStation Group, Inc., both operating, and providing products and services, under the TradeStation brand and trademark. When applying for, or purchasing, accounts, subscriptions, products and services, it is important that you know which company you will be dealing with. Visit www.TradeStation.com for further important information explaining what this means.
Exchange Traded Funds (“ETFs”) are subject to management fees and other expenses. Before making investment decisions, investors should carefully read information found in the prospectus or summary prospectus, if available, including investment objectives, risks, charges, and expenses. Click here to find the prospectus.


KWEB: Exposure to Chinese tech marketBased on past cycle history, the SHSZ300 (Chinese S&P 500 more or less) tracks the US markets bull runs, though starting with a large delay.
We're fed a lot of bad news about China, but the fact is, they're making some economic power moves, and positioning themselves for the AI Industrial Revolution.
The Chinese markets are bottoming out, and it's a good time to get exposure to the Chinese markets.
I will be buying in around the buy zone ($45 - $41).
#China #MCHI #KWEB

$KWEB - Breaking out!AMEX:KWEB A convincing descending wedge breakout on KWEB. This will lift NYSE:BABA NASDAQ:JD NASDAQ:PDD $BIDU.
Targets:
$32
$36
Risk:
$24

Opening (IRA): KWEB May 17th 24 Monied Covered CallLooking to get a fill on a monied covered call in KWEB (IVR/IV 12/33.2) while I wait around for some (or any) vol to show itself in the broader market. That IVR isn't great, but I'm going small so that I can potentially add at more favorable strikes/share cost bases should an opportunity present itself.
It's pre-market, so bid/ask is somewhat wide on both the shares and the short call, but I'm looking to buy a one lot and sell a -75 delta call against for around 26.09 in order to emulate the delta metrics of a 25 delta short put, have built-in short call defense, and to take advantage of IV skew on the call side (it's 39.4% at the 24 call strike; 32.4% at the 24 put).
On a side note, the on margin variant of a Plain Jane short put isn't paying spectacularly from a dollar and cents standpoint: the May 17th 24 short put is paying .37 at the mid, which isn't anything to write home about, but that would be on a BPE of 6.72 (5.51% ROC at max; 2.75% at 50% max; 23.63 break even) should you want to go the standard short put/acquire/cover route.
Break Even/Cost Basis in Shares/Buying Power Effect: 23.09
Max Profit: .91 ($91)
ROC at Max: 3.49%
ROC at 50% max: 1.74%
In all likelihood, I'll have to "penny up" if I don't get a fill for 23.09 ... .

$KWEB - Close to breaking outAMEX:KWEB Kweb is on the verge of breaking out!
Targets:
$29
$31
$36
Risk:
$22
kweb Looking at an accumulation phase of AMEX:KWEB #kweb on the weekly where a possible dca opportunity

$KWEB Volatility Contraction or Top of Downtrend Channel? AMEX:KWEB the Chinese stock ETF is looking like a due or die situation here. The negative is that it is in a longer-term downtrend. It is now just hitting the underside of the 50 DMA; it is below the 40 Week MA and nearing the top of the downtrend channel.
Here are the positives; it seems to have stopped the downtrend with a slight undercut and rally from the previous low. It is above the shorter-term MAs and looking like it might get over the 50 DMA. Looking at volume, there is buying with green volume days higher than red volume days.
Here is my plan. If it can close over the 50 DMA, I will start a ¼ sized long position with a stop on a close back under the 50 DMA. If it can break above and close over the upper downtrend line, I’ll add another ¼ size. After that I will wait for some consolidation / minor pullback and resumption of up trend to bring to a full position. All TBD.
Ideas, not investing / trading advice. Comments always welcome. Thanks for looking.

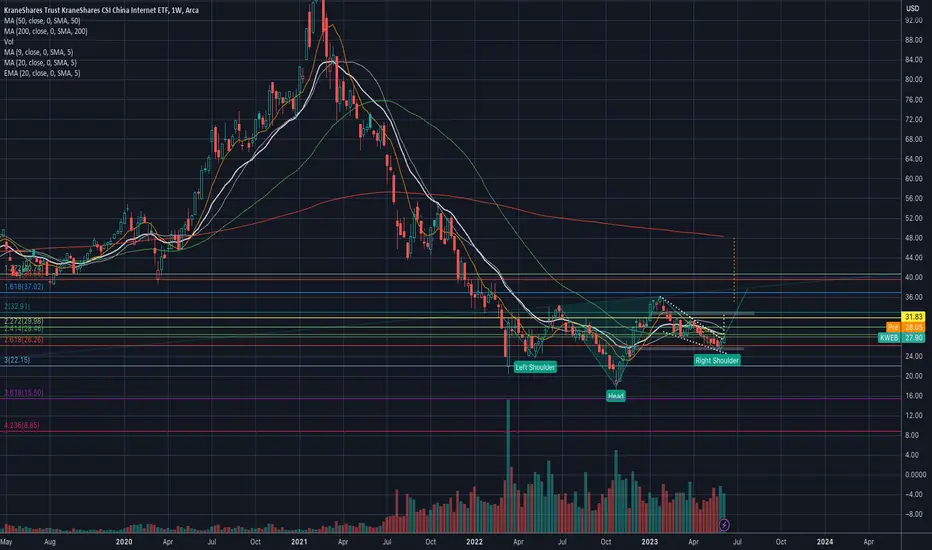
$KWEB - Can it complete the inverse head and shoulders pattern?AMEX:KWEB There is a good chance that the inverse head and shoulders pattern might complete, and the stock could run to the $47 area.
Earnings from NYSE:BABA , NASDAQ:JD , and NASDAQ:PDD were way better than expected.
With the media and analysts pounding on the Chinese economy daily, sentiment on the Chinese economy is at its lowest point ever. A little bit of positive news could drive Chinese tech stocks higher.
Upside targets:
$35
$40
$47
Downside risk:
$24

KWEB Inverse H&S on Weekly chartLooking at KWEB or Chinese TECH. Inverse H&S Pattern potentially. On fundamental side if China continues to cut rates and add fiscal stimulus this could potentially break out and run. China is only major country cutting interest rates currently.


$KWEB - Chinse TECH stocks are back babyBaba was just the beginning. Wait until the rest of the chinese market takes off. Stimulus took longer than expected to boost the market.... delayed reaction now in full effect. Options play on this Nov. 17th $33.00 strike.... for $0.98 currently ...... easily a 2000% banger for fair value/price on this stock. Realistic target for stock price = $53.00

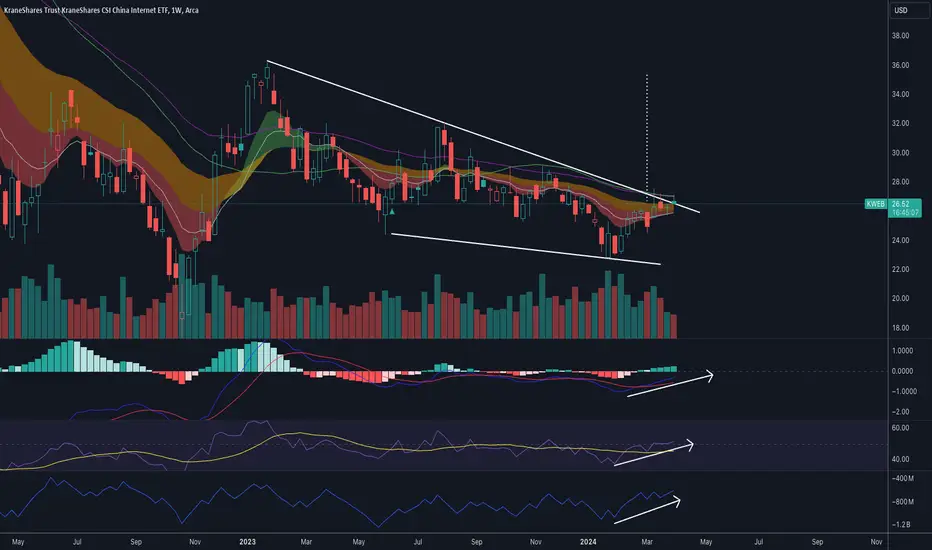
$KWEB - breaking outAMEX:KWEB looks like it is breaking out of the descending wedge. If you zoom out the IHS is still intact. If the price can get above $28.50 it could run to $31 - $33 area. Downside risk is $26 - $25.
Not an investment advice.