Can SOXL trade near 20 $ again? Market reversal, probably, market selloff pausing.. confirmation regarding our trading strategies is what we need, a great time to catch up SOXL again because the semiconductor sector was punished!!
Stay safe,
Sebastian.
SOXL trade ideas

SOXL that wayThe index is a rules-based, modified float-adjusted market capitalization-weighted index that tracks the performance of the thirty largest U.S. listed semiconductor companies. The fund is non-diversified.

SOXL: A so risky scenerio!SOXL: risky scenerio
-Important key level at zone 7.7, forming Head and Shouder pattern with high supply volume.
-The uptrend structure has not yet been broken out, but if this key level been through, a risky scenerio for a deep sink.
.
Wait and see!
US STOCKS- WALL STREET DREAM- LET'S THE MARKET SPEAK!

SOXL....complete sweetheartWhat more could people ask for! Great ETF, great price, and short window for a major upside to a demand heavy industry. There's a lot of interest in this one. It will likely spike very quickly. Good time to get in or watch by the sidelines!
Best of a luck and always do your own due diligence! I'm wrong 20% of the time...

$SOXL $SOXX BOTTOMED (ASCENDING TRIANGLE)An ascending triangle is a bullish breakout pattern that occurs when the price breaks through the upper horizontal trendline with increasing volume. The upper trendline is horizontal, showing nearly identical highs that create a resistance level. Meanwhile, the lower trendline slopes upward, indicating higher lows as buyers gradually increase their bids. Eventually, buyers become impatient and push the price above the resistance level, triggering further buying and resuming the uptrend. The upper trendline, which previously acted as resistance, then becomes a support level.
Semiconductors NASDAQ:SOXX are crucial to the United States for several reasons:
Technological Backbone: Semiconductors power essential technologies like smartphones, computers, cars, and medical devices. They are integral to almost everything with an on/off switch. The semiconductor industry aka NASDAQ:SOXX significantly contributes to the U.S. economy. It supports millions of jobs and drives innovation in various sectors, including artificial intelligence, biotechnology, and clean energy.
Semiconductors are vital for national security. They are used in military systems, aircraft, weapons, and the electric grid, making them critical for defense and infrastructure. Maintaining a strong semiconductor industry helps the U.S. stay competitive globally so BUY AMEX:SOXL , $SOXX. The CHIPS and Science Act, for example, aims to revitalize the U.S. semiconductor industry, create jobs, and support American innovation. Strengthening the domestic semiconductor supply chain reduces dependency on foreign sources, enhancing the resilience and security of supply chains.
BUY NOW AND HOLD

Opening (IRA): SOXL March 21st 29 Covered Call... for a 26.85 debit.
Comments: High IV; starter position. Selling the -75 delta call against shares to emulate the delta metrics of a 25 delta short put, but with the built-in defense of the short call.
Metrics:
Buying Power Effect/Break Even: 26.85
Max Profit: 2.15
ROC at Max: 8.01%
50% Max: 1.08
ROC at 50% Max: 4.00%
Will generally look to take profit at 50% max, add at intervals if I can get in at better strikes/better break evens than what I currently have on, and/or roll out the short call if take profit is not hit.

Opening (IRA): SOXL April 17th 24 Covered Call... for 22.48 debit.
Comments: Starting my run at April, adding at strikes better than what I currently have on.
Metrics:
Buying Power Effect/Break Even: 22.48
Max Profit: 1.52
ROC at Max: 6.76%
50% Max: .76
ROC at 50% Max: 3.38%
Will generally look to take profit at 50% max, add at intervals assuming I can get in at strikes better than what I currently have on, and/or roll out short call if my take profit is not hit.

Opening (IRA): SOXL May 16th 17 Covered Call... for a 15.68 debit.
Comments: Laddering out a smidge here, selling the -84 delta call against shares to emulate the delta metrics of a 16 delta short put, but with the built-in defense of the short call.
Metrics:
Buying Power Effect/Break Even: 15.68
Max Profit: 1.32
ROC at Max: 8.42%
50% Max: .66
ROC at 50% Max: 4.21%
Will generally look to take profit at 50% max, add at intervals, assuming I can get in at strikes/break evens than what I currently have on, and/or roll out short call if my take profit is not hit.
Long SOXL: Longer term trade, but one that has worked since 20164 Trades over 8 years
SOXL 3X Levered ETF on Semiconductors
High to low:
Start 2/12/2016: +1,338%, 763 Days
12/24/2018: +392%, 393 Days
3/18/2020: +1,821%, 651 Days
10/13/2022: +937%, 637 Days
Not a quick trade, but it has been profitable.

$SOXL Inverted Cup and Handlel (SELL NOW!)Grasping chart patterns is essential for market participants. This article explores the inverted cup and handle formation, a bearish signal that suggests potential downward movement.
The inverted cup and handle, also known as an upside-down cup and handle pattern, is a bearish chart pattern that can appear in both uptrends and downtrends. It is the reverse of the traditional bullish cup and handle pattern. The inverted formation consists of two main components: the "cup," an inverted U-shape, and the "handle," a small upward retracement following the cup.
SELL NASDAQ:NVDA AMEX:SOXL NASDAQ:AMD NASDAQ:AVGO NASDAQ:QCOM NASDAQ:MRVL NASDAQ:MU $TXN.
Lets BUY it again WHEN IT'S LOW guys.
Mark my word

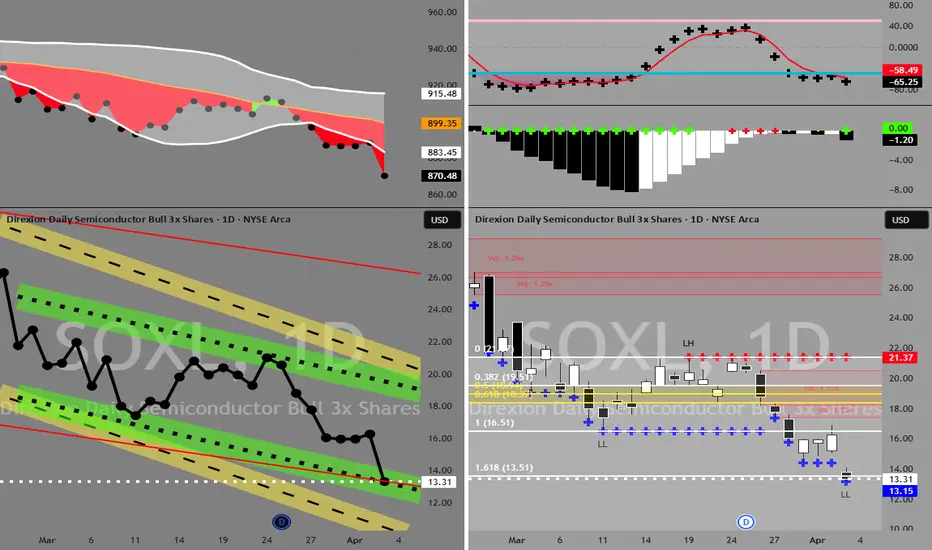
SOXL in Buy ZoneMy trading plan is very simple.
I buy or sell when at three of these events happen:
* Price tags the top or bottom of parallel channel zones
* Money flow spikes beyond it's Bollinger Bands
* Stochastic Momentum Index (SMI) at near oversold overbought level
* Price at Fibonacci levels
So...
Here's why I'm picking this symbol to do the thing.
Price in buying zone at bottom of 2 of 3 channels
Stochastic Momentum Index (SMI) at oversold level
Money flow momentum is spiked negative and under bottom of Bollinger Band
Price at or near Fibonacci level
Entry at $13.30
Target is upper channel around $19
Bullish Swing Trade - SOXLHey all -
Sharing my mid-term analysis of SOXL. We've reached buy levels on the daily, weekly, and monthly charts.
Ideal entry between $16.46 - $18.12.
With patience, swing up to the $25-31 dollar area. Specifically for options, I'd suggest an August expiry, with an ITM or ATM strike price.
Happy Trading!

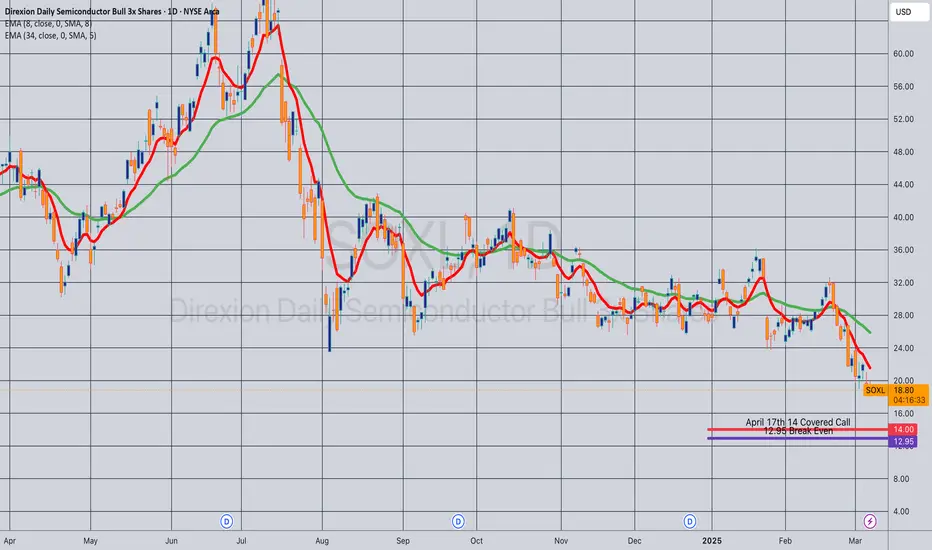
Opening (IRA): SOXL April 17th 14 Covered Call... for a 12.95 debit.
Comments: High IVR/IV. Adding at strikes better than what I currently have on, selling the -81 call against shares to emulate the delta metrics of a 19 delta short put, but with the built-in defense of the short calls.
Metrics:
Buying Power Effect/Break Even: 12.95/share
Max Profit: 1.05
ROC at Max: 8.11%
50% Max: .53
ROC at 50% Max: 4.06%
Will generally look to take profit at 50% max, add at intervals if I can get in at break evens better than what I currently have on, roll out short call if my take profit is not hit.
SOXL... for anyone short or bounce hopefulls..levelsAnother Fib Cyqo-B0wStr1ng, from two tops and then dragged to the lowest point between them.
Not everything is random...you just got to be random to find the hidden messages in the code, aka chart.
Notice the Log and no Log in the bottom right of the scale, apply it to see what you may be missing.
Enjoy:
daily close: no log 1st..with log 2nd
4hr close: no log 1st..with log 2nd
4hr far out: no log 1st..with log 2nd

SOXL - Trades Just a log of my SOXL short and long trades .
Will update 2025 trades when I use this etf at end of day . In the comments
SOXL/SOXS are great options for shorter term red market day trades and or recovery .

DCA Play $SOXL | Good R:Rhere are my key observations based 4-hour chart on AMEX:SOXL
Price is in a tight consolidation. must break $28.54 with an abs close to see upside potential.
If rejected, a revisit of $26.35 or lower could happen.
However, this sets us up for a great averaging play
$26.35 is a strong support, meaning price may bounce before reaching $25.57, a logical place to accumulate.
SL @ $23.77 (or close =< .79) a break below 23.80 will mean further downside. (best to confirm with close)
T1 @ $30.00 first aligns with 50% Fib. standard reversal area.
T2 @ $32.70 to gap fill if momentum is persists
Why this works:
no need to predict the exact bottom, nature of cost avg'ing
earlier rebound to $25.57 allows you to maintain exposure
scaling out at $30 and $32.70 locks in profits while allowing more upside
Good risk-reward ratio (~1:2.5 or better)
Risks to consider:
breaks <$23.79, will go lower (possibly retesting $22-$21 range)
If volume remains weak, recovery to $30 may take longer than expected
semiconductors remain somewhat bearish, meaning AMEX:SOXL could lag even if it stabilizes a bit
Watch for volume confirmation on the bounce
Play for T2: In the event that price reclaims $28.54 quickly, consider adding to the position for momentum play to $30.00
Other supporting indicators:
a descending wedge has formed, this occurs after a downtrend where price is making lower highs and lower lows, but the slope of the downward move is narrowing; a bullish signal because it shows sellers losing strength, and a breakout to the upside is likely.
Last Vol was at 43.88M, lots of involvement
Implied Volatility was at 91.45%
β 4.32 : market expects large swings
Put to Call ratio (0.67) indicate to me that there are more calls than puts out, a bullish sentiment for those who aren't familiar with options.

DCA Play $SOXL | TARGET 1 REACHEDPrice action moved with good momentum and maintained volume for the trading day.
The original call is good to go:
T2 @ $32.70 to gap fill if momentum is persists (poor spelling when analyzing at 3am - but you get the gist)
I expect a minor pull back before gap fill; depending on price action, may or may not add to position.
A gap up would be signal to close all profits, with a +10% PnL.
gg

Opening (IRA): SOXL March 28th 20 Covered Call... for a 18.91 debit.
Comments: I wanted to take advantage of this little bit of weakness here, but at less risk than what I ordinarily take, giving me more "room to be wrong." Here, selling the -84 delta calls against shares to emulate the delta metrics of a 16 delta short put, but with the built-in defense of the short calls.
Additionally, it's at strikes better than what I currently have on ... .
Metrics:
Buying Power Effect/Break Even: 18.91
Max Profit: 1.09
ROC at Max: 5.76%
50% Max: .55
ROC at 50% Max: 2.88%

Is SOXL ever going to breakout...Have held long on SOXL for about 5.5 weeks now with an average price of $30. I identified a wedge alongside "hidden" divergence on the MACD on a weekly time scale but it's still been pretty much in the same zone/area of consolidation.
When the DeepSeek news broke out, I was for sure ready to cut ties with this one since the Nasdaq was in a complete bloodbath but I gave it some room and glad to see it has been recovering OK for now.
My original target for one is/was $40 but I'd consider taking it off the table if we saw $35+ again. We'll see how this week performs and watch for that gap being filled.
Good Luck & Trade Safe.

Opening (IRA): SOXL March 21st 23 Covered Call... for a 21.09 debit.
Comments: Adding at strikes better than what I currently have on, selling the -75 delta call against shares to emulate the delta metrics of a 25 delta short put, but with the built-in defense of the short call.
Metrics:
Buying Power Effect/Break Even: 21.09/share
Max Profit: 1.91
ROC at Max: 9.06%
50% Max: .86
ROC at 50% Max: 4.03%
Will generally look to take profit at 50% max, add at intervals, assuming I can get in at strikes better than what I currently have on, and/or roll out the short call if my take profit is not hit.

SOXL Has Room to Run?This one has a double bottom look, with a higher low, and another 4% remaining to hit take profit enroute to retesting the neckline before breaking out (another 8% from here) or balance and fail! Stop loss of 5% is pretty steep, so typically I either lower my position size or stop loss. Even at 4% stop loss, according to backtest results this wins more than it loses and has done pretty decent in the past, as I have been forward testing this model for over the past 18 months and profiting from over 100 different equities that I signal on.
The King Trading Momentum Strategy combines the 5 EMA crossing above the 13 EMA, RSI strength, favorable momentum as measured by ADX plus evaluating recent volume changes! SOXL and over 100 equities are built into this script with optimal backtest take profits and stop losses and can be toggled on by simply checking a box (default they are turned off). Check out my script, as I am always looking for people to help test and I am always interested in feedback...

Opening (IRA): SOXL March 21st 20 Covered Call... for an 18.21 debit.
Comments: Adding to my current position at strikes better than what I have on, selling the -75 delta call against shares to emulate the delta metrics of a 25 delta short put, but with built-in short call defense.
Metrics:
Buying Power Effect/Break Even: 18.21
Max Profit: 1.79
ROC at Max: 9.83%
50% Max: .90
ROC at 50% Max: 4.91%
Will generally look to take profit at 50% max, add at intervals assuming I can get in at strikes better than what I currently have on, and/or roll out short call if my TP is not hit.

Opening (IRA): SOXL March 21st 23 Covered Call... for a 20.87 debit.
Comments: High IVR/IV. Adding to my position at a break even better than what I currently have on. Selling the -75 call against shares to emulate the delta metrics of a 25 delta short put, but with the built-in defense of the short call.
Metrics:
Buying Power Effect/Break Even: 20.87
Max Profit: 2.13
ROC at Max: 10.21%
50% Max: 1.07
ROC at 50% Max: 5.11%
Will generally look to take profit at 50% max, add at intervals (assuming I can get in at a break even better than what I currently have on), and/or roll out the short call in the event take profit is not hit.
