Soxl Def watching this next test. We have a level to lean on, 10.61 was previous low that piled a decent rally, will we double bottom on that low? Wicking below is still ok, as it sometimes stoploss hunts to take more ppl out of their trade, wait for a rounding on that support, and a push. If this holds we could be looking at a sick trade entry. This still has some time to fall more so be patient
SOXL trade ideas

i like semiconductors correcting from oversoldsome meaningful bounce is taking place in big tech at least intraday, andsemiconductors as a lead bear are taking part. SOXL is trapped under yeasterdaysgap up, and todays gap up. ive marked outlong short pivot and drawn a bull and vear scenario. there is no bias, but i am long semiconductors when price is so low, at least intraday.

SOXL - At a Buy Point? SOXL - WEEKLY LOG Mode
I know what you're thinking....... Don't shoot me I'm just the messenger.
This chart implies the sector deserves some near term consideration..... as hard as that may seem at this point.
Buy when there's blood in the streets...
Risk is well defined here. I would use the sub .786 Fib area as a stop point... See below.
Here is the DAILY :

short at key resistance levelsthis ramge will continue to tighten, and we will likely get a bear break. above pivot target upper horizontals below pivot aim for lower horizontals. semiconductors have been a major focal point of this bear market, and they will be a big recovery story when we exit it.

one minor hickup for broader marketssemiconductors have been a lead bear in this downturn since december, and a lead bull on the monthly bounce from the lows since july. if we roll over here setting a lower high on this etf around the first upper horizontal i would look for broader markets to consolidate on the daily. if we treat pivot as support i would target the upper horizontal and look for continuation in broader markets. most likely scenario is a gap down followed by a rally to close with price action after to be determined.

SOXL - the window opensAn update to the earlier SOXL post...
Previously identified as a potential, in what appeared to be a really nice technical wedge breakout. And there is more, much more as a reader gave some heads-up about the semiconductor bill.
Techncially, SOXL has been bullish, but is also susceptible to strong retracements, which took place over the week that just passed. The weekly chart maintains its bullish stance, despite the MACD not yet crossing over into bullish territory. The RPM is indicating a continued momentum as well.
Details in the daily chart are more specific on the price action, and after breakout, there was a shallow retracement, and then a quick rally up. Then the more significant retracement came, retraced to 61.8% Fibonacci level, and bounced off. What is interesting is that in doing so, it created a gap (from a gap down) as it broke below the daily 55EMA, and then gapped up to subsequently close the gap (bullish gesture here). This price action gave the weekly chart that nice long underside tail (green ellipse), suggesting bullish price action, and this bullishness to follow in the next couple of weeks.
Fibonacci, and other geometrical, projections have been updated and adjusted (higher!) with the upside target at 29.58, especially after breaking above 22.29.
The daily technical indicators appear to be turning upwards and the early part of the coming week is expected to show a bullish hand, that probably leads to the rest of the projections into September where it should meet the weekly 55EMA. Watch for it!
The window opens...
Heads up!

semiconductors could be in for a huge bull moveif we stay above pivot, there is nothing stopping the top of the sss supply zone from being reached, and qqe rsi signaling bull with a green sss on the weekly. if we pivot higher i would aim for upper horizontals, if we fin ourselves making a bear cross at this key resistance i would aim for lower horizontals if sss stays red.

looking for signs of temporary bull exhaustionthe rally has been very strong for a week, and im looking toward the resistances carved out over the last few days to find a bear entry scouting hourly rsilevels and sss signal to turn red qqe making a short entry

SOXL - a second bite at the cherryPreviously heads up, and with some very interesting feedback from NickQuick7 about the semiconductor Bill passed by Senate, SOXL continues to be of high interest in the watchlist.
The past three trading sessions have rebounded from the daily 62% retracement level, and is projected to move further to 23.50.
In the bigger picture, a target for 33 is mooted.
Weekly technicals are good, and daily technicals are wearing out a little...

some continuation followed by consolidative move in semissemiconductors are on an upward trajectory,and a sell the news event has marked new highs in 3x leveraged semiconductor bull etf SOXL. as long as we remain in this uptrend the market will have no trouble with a third drive to the upside, but during which i would be looking for signs of exhaustion, as some kind of daily topwick could form around rhe $20 area. if we get movement above this supply zone the chart will look more bullish, but closing the gap and pivoting to an hourly equillibrium in an overbought area rsi. that being said a higher supply could take a day or two so as long as sundays numbers are positive or negligible loss nq1! semiconductors should find a local extreme to the highs early or mid next week and consolidate. upper horizontals are stiff resistance, and lower horizontals are areas to be explored for short candidacy.

Easy Long - THIS IS NOT ADVICE!!!congress providing fundamental promise with passing a bill that could influence markets to buy this ETF, Technicals are setup to look for a return to previous levels off the backs of a strong Bulldiv rally from oversold levels, setting a stop below the recent swing low allows for a technical trade plan that removes emotion. The simple R/R lines up with the bottom of the recent range making it conservative, too. if the position is large enough, it could be managed through selling calls and use the premiums to hedge against a drop, just close out any short calls before dumping shares and make sure any short calls are sold with a strike above entry.
NOT ADVICE, SIMPLY FOR FUN AND THEORY

SOXL - An interesting proposition TAKENGiven a heads up from a friend some time ago, SOXL was closely tracked and position taken at 14.80 (white arrow).
There was immaculate synchrony on the weekly and daily charts, as it fell in a falling wedge. The weekly technical indicators turned as the weekly candlestick hinted of a possible trend change.
The daily technical indicators similar in sync and a break above the HULL moving average also coincided to a breakout of the wedge.
Looking for a move to 32. A very good amount of space, over the next couple of weeks.

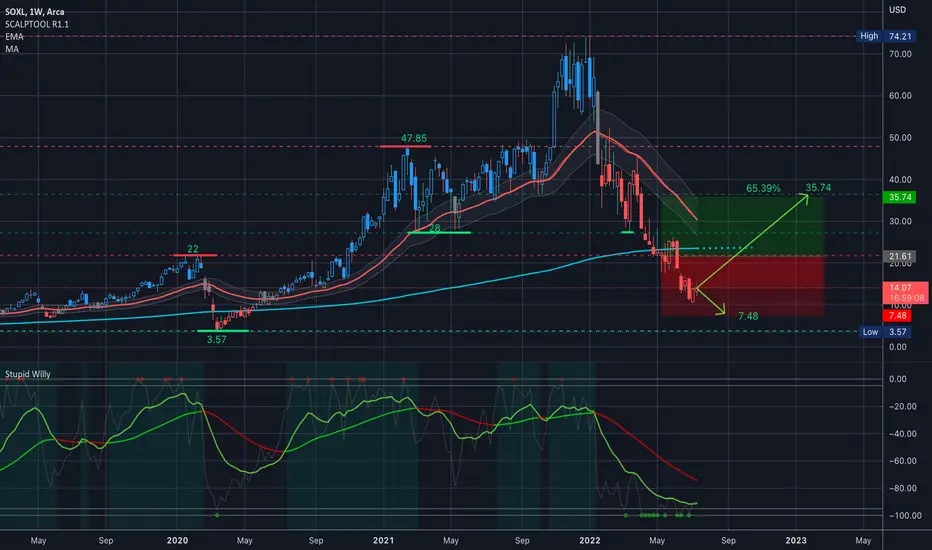
$SOXL Analysis, Key levels & Targets $SOXL Analysis, Key levels & Targets
This, without a doubt has been one of the most exhausting positions I have on right now…. But that is the nature of 3x leveraged instruments….
I have 310 shares, with an average of 21.61 and I am 34.72% down.
SO, for anyone that remembers this strategy from last year… the next add will be to double my position at 7.48. I don’t have the 7.48 order set yet, but I have alerts at $10 and once it hits 10 that order will be in…
From here my sell target is 35.74 —> looking for a 65.39% profit…. And of course that target will change if the 7.48 double target triggers….
Looking at stupid Willy, there is still room and I can see a real possibility of 7.48 hitting… but it doesn’t have to…. Looking at some semi companies, a lot of them are looking to test their 200MA on the weekly, but also they are hooking upward at their weekly 180EMA so I’m comfortable with my position here.
If you’re playing this one with me - now you know how insane my tolerance for volatility is….
Happy trading, y’all…
On a side note: what's your favorite Semiconductor company? I trade AMD and ON, and I track NVDA
—-
I am not your financial advisor. Watch my setups first before you jump in… My trade set ups work very well and they are for my personal reference and if you decide to trade them you do so at your own risk. I will gladly answer questions to the best of my knowledge but ultimately the risk is on you. I will update targets as needed.
GL and happy trading.
IF you need anything analyzed Technically just comment with the Ticker and I’ll do it as soon as possible…
Trade of the Year 2022 for patient traders..!The semiconductor industry has fundamentally the strongest demand, and the supply shortage is expected to be extended to 2023.
But
The biggest companies in this industry have experienced a double-digit correction or have entered the Bear market(Correction>20%)
Look at their charts:
NVDA is down more than 25% YTD:
TSM is down almost 19% YTD:
AVGO is down 12.7% YTD:
INTC is down 9.5% YTD:
TXN is down 8.7% YTD:
QCOM is down 26% YTD:
AMD is down 32% YTD:
ADI is down almost 12% YTD:
MU is down 22.6% YTD:
MRVL is down 30.5 YTD:
In most cases, there is room for further price decline..!
Although a further decline is likely, we should monitor them closely, because a rebound could be the trade of the year if you use SOXL..!
I am almost confident a triple-digit gain is brewing in SOXL, however, you shouldn't get excited and jump the gun soon, let it go lower..!
I will publish the analysis whenever the reversal pattern forms..!
Education:
Charlie Munger:" you need patience, discipline, and an ability to take losses and adversity without going crazy."
If you think I don't know what I am talking about, check this:
Best,
Dr. Moshkelgosha M.D
DISCLAIMER
I’m not a certified financial planner/advisor, a certified financial analyst, an economist, a CPA, an accountant, or a lawyer. I’m not a finance professional through formal education. The contents on this site are for informational purposes only and do not constitute financial, accounting, or legal advice. I can’t promise that the information shared on my posts is appropriate for you or anyone else. By using this site, you agree to hold me harmless from any ramifications, financial or otherwise, that occur to you as a result of acting on information found on this site.

semiconductors climbing out of the holeright now major indices and the nasdaq especially is banking on semis carrying a significant bounce out of the giant hole they have dug for themselves and us all. it follows that if we can hold 15.80s breaking 16.80s and continue with TRAMA staying over VWMA with both averages rising together that we should hae the go ahead to close the gap around 18.60s (strange that the decimal and integer are inverted 🤔 for either target). should ve a mega green day if we just manage to keep oscillators headed toward overbought with the price making higher lows.

SoxlCreating a double bottom. We didn’t breach my low which is perfect. This could target 18.80 as falling wedge resutance if we close above 15.50 bice trade setup stop below 13.16 long to 18.80. If that breaks 23.30 is first resutance

Soxl Large falling wedge. This thing is been extremely Berish and losing that $18 range in backtesting it yesterday as resistance was a huge sign Of a crazy Bearish move. However if this falling wedge that price has remained in for quite some time holds it stands true, 12.55-12.60 Could hold as support and that might be an area to try to grab a long position with stoploss in place below 1230 as a small risk once the momentum settles to the downside here. Holding that area as support could bottom this down turn for the short term and potentially long-term depending on how price reacts in those levels

Bottom in SOXL is in?Arguments pro a bullish scenario in $SOX / $SOXL:
We have reached the 78.6 % fib retracement in SOXL
According to the seasonal chart from the last ten years (see the SEASONAX screenshot at the top), in 9 of 10 cases the $SOX had made a bullish move from the 17th of May until the 8th of June
At some point, the semiconductor shortage must affect the prices ...
Contra arguments:
$DXY is rising / interest rates are going up
... anything else?
I can't see any significant arguments standing against the bullish case in $SOXL. If you have anything - please drop a comment below!

semiconductors likely have some continued downsidesoxl is pretty much plummeting if we get a significant gap down and cant set a higher low 4hr the 15 minute trend will continue downwards until the 4hr is bullishly diverged stoch, rsi a lot of people are covering, and that may lead to some squeeze, but the over all trend is down if we close gap from either direction, and it looks like it is setting a lower high 4hr i would continue to sell semis. if we close gap from either direction and it looks like the test was sucessfuly holding some higher low around the thursday close its more bullish intermediate term but id imagine this is finding a daily lower high even if it recovers some or corrects sharply only to fall again.
22.04, 21.74, 21, 20.76, 20.22 key levels right now SOXL.

the 4 hr is at critical .5 level and oversold stochfib of bounce gives us about 50% retracement if there is some recovery to tighten in range we could look back up at 22.23-22.48 setting a daily higher low if market decides to gap up friday. if vwma keeps rising and trama flattens out we will have a bounce in semis. if these indicators keep bearish divergence we are likely continuing lower in broader markets. $23 is still a critical level for this trade. $20.96 is the next level if we continue this pop down. semis started this correction only they can get it out.

SOXL - Semi's are looking strong againI am always looking for those low risk/high reward plays. SOXL looks like a strong contender as AMD, NVDA, AVGO and even INTC had a decent day.
Lots of room to run if it continues through $26.50 (a good place for paper buy stops)
Things are on hold if it slides back into the box...
It needs to avoid that downward channel or things get bearish.

SOXL bullish prediction
Looks bullish, but with some pains ahead, if you have nerves of steal target of 28 is very possible.

watching for continuation next week 📊SOXL bouncing off extreme trend support and now breaking local trend resistance, lovely setup!
we can target 29.90-37.31 now
