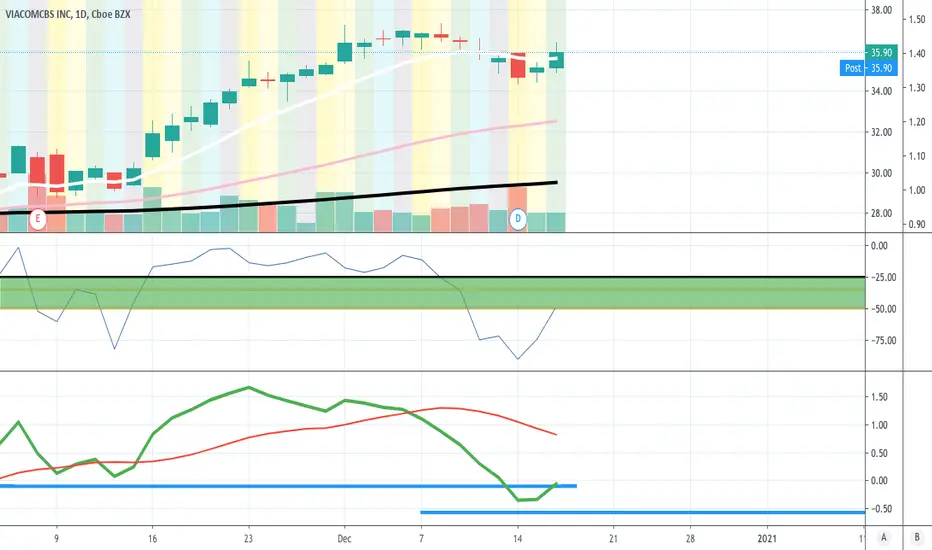
VIAC On WatchWatching VIAC for a break over the highs.
Just Had 50/200 cross on daily and has a gap to fill up above. Also looks like it just broke over a downtrend line. Building a really nice daily flag here as well.
Looking to go long out to December 40.00 calls at a close above the highs. Nice volume on them too.
C1BS34 trade ideas

VIAC recovery VIAC is one undervalued with strong fundamentals , it has been recovering very well from COVID effect and still long way back to levels prior to pandemic

$VIAC mass media pumpVIAC is looking good for a short term run, maybe longer, but Ill be out be end of the week. 10 EMA cross and strong momentum.s looking good for a short term run, maybe longer, but Ill be out be end of the week. 10 EMA cross and strong momentum. Today's gain was nice
Fresh out of consolidation!Short term targets: 31.50- 34.60- 41
(Some people like messy charts, I don't!)

ViacomI'm looking for a move up due to the anticipated move down. However, I'm bullish once there's a B.A.R. of the $49 - $53 levels. We shall see...

VIAC inverse H&S patternViacom CBS has been trading at an extremely attractive P/E ratio for a while now and it appears to be poised for a breakout. The deep-red line is the line in the sand. I see an inverse head-and-shoulder pattern indicating a bullish breakout could be in the works. Great long-term hold and has a surprisingly impressive streaming business. I don't expect a huge spike in one day, but I expect it to be a slow and steady upward trend as the rotation from growth and richly-valued stocks continue into the stocks that have still not had their day in the sun. The current P/E ratio is about 8x; on average 17x is considered normal. That's an easy double overtime in my opinion.

RSI indicated overbought, resistance zone and Dave Chappelle Dave Chappelle declared war on VIAC via his Instagram regarding Dave Chappelle's Show. Competition such as Netflix and Disney will eat HBO alive.

VIAC Elliot waveBack in a bull market, we'll keep an eye on this one. Buying a couple shares on todays dip and maybe some options calls to test the waters

VIACOM IDEAViacom has been in an uptrend since March, and I think this week will test this uptrend. The trendline has grinded the 50 EMA over the previous two trading days, but did finish the week on a strong note.
I will be looking for the trendline to break ~28.57 as resistance, and looking for an entry point at ~29.10, with stop loss at 25.03.
If successful, I can see VIAC running up to 31.49 especially given earnings season. ViacomCBS has been one of the main broadcasters of NFL, and the public has been more intrigued than ever this season given the pandemic.

$VIAC ViacomCBS $35 Target Golden cross just complete, so very bullish for the future.
The gap fill open and close are the obvious levels to watch for the rally to continue


Saham Syarikat VIACVIAC
ViacomCBS Inc.
Communication Services | Entertainment | USA
VIAC adalah kod bagi syarikat ViacomCBS Inc yang diperbuat dari segi sektor perkhidmatan.
Mengikut pemerhatian gelombang sahlun tentang saham ini adalah uptrend dalam tempoh 3 bulan lepas.
Dari segi kriteria syariah setakat hari ini, saham ini adalah TIDAK Patuh Syariah.
PENAFIAN: Maklumat dan penerangan sebarang senarai saham, derivatif, komoditi, matawang kripto, bon , sukuk atau sebagainya yang dinyatakan adalah sebagai tujuan pendidikan semata-mata dan bukanlah saranan pembelian mahupun penjualan. Segala liabiliti risiko dagangan adalah diatas tanggungan sendiri. Anda hendaklah mendapatkan rujukan dan nasihat dari pakar dan konsultan bertauliah.
www.sahlun.com

$VIAC downtrend 2017 to pandemic, now in an uptrendIf it can get through the trendline, looking for 33 then 35. Recent iheartradio partnership might be what it needs to get its mojo back. VIAC

VIAC picture perfect... or?No positive news yet, but technically speacking it's ready for breakout. I really like the chart and the fundamentals.
Just above sma 200, long consolidation wedge, higher lows.

VIAC - wants to go higher?The chart is perfect.
Long bullish channel
No strong resistance till 34-35
Just wondering of the stock can go further up pure on technicals, with no news or catalyst.
We will see...

$VIAC Viacomcbs Breaks major resistance The stock finally broke above the 200ma on Monday.
Possible long above $28.00
Upside target $30.00 to key psychological resistance
$31.18 is a major Horizontal resistance to consider.


Will the recovery continue?Well, I guess the chart speaks for itself. Very strong uptrend, downtrend on 1H is done. Buy @ $20-23, TP $28-32-35, SL $18.

VIAC Long, Daily EMA144 as supportCondition:
#1 Daily EMA144 is support
#2 Swing(A) crossed SMA50 and EMA144 (Normally, this is a pattern of beginning in uptrend)
#3 Swing(C) Began from SMA50
#4 No price change on 8/6/2020 Earning
Estimate: Range of Swing(C) = Swing(A) (ABC pattern, even if it is a consolidation only)
Entry below 26.5
Stop 24; when Trendline break
Target1: 35; risk/reward=1:3
Target2: 40; risk/reward=1:6
I am not a Pro trader. I need few months to work on rule based trading strategies.
If you like it, thank you for your support. Please use SIM/Demo account to try it, until my trading plans get high winning rate consistently.

VIAC - Cup & Handle? (of sorts)VIAC hit a high of 28.50 on 8th June before languishing in a severe and protracted pullback.
On 30 July it finally rose above 25.60 after forming what resembled a mini cup & handle ("resembled" as it did not fit all the criteria for a C&H, namely, a prior uptrend). However, it now appears to be forming the "real" C&H (at least the cup, we do not know yet if a handle will form) with the rim top @ 28.50.
Eventually should it rise above 28.50 (with or without a "handle" formation), then I am expecting it to hit a target of at least 35 (C&H target).
Let's see if it plays out!
Disclaimer: This is just my own analysis and opinion for discussion and is not a trade advice. Kindly do your own due diligence and trade according to your own risk tolerance. Thank you.


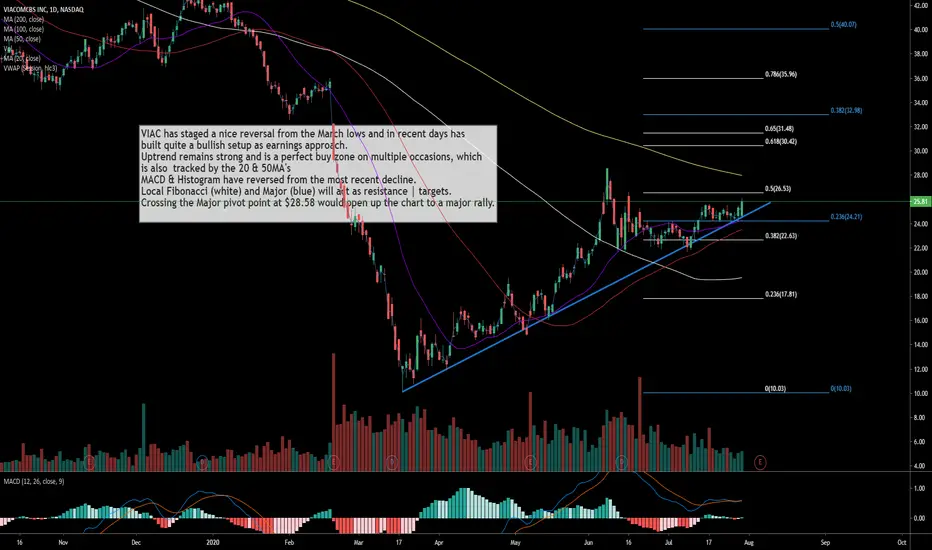
$VIAC ViacomCBS Inc Long Into Earnings
VIAC has staged a nice reversal from the March lows and in recent days has
built quite a bullish setup as earnings approach.
Uptrend remains strong and is a perfect buy zone on multiple occasions, which
is also tracked by the 20 & 50MA's
MACD & Histogram have reversed from the most recent decline.
Local Fibonacci (white) and Major (blue) will act as resistance | targets.
Crossing the Major pivot point at $28.58 would open up the chart to a major rally.
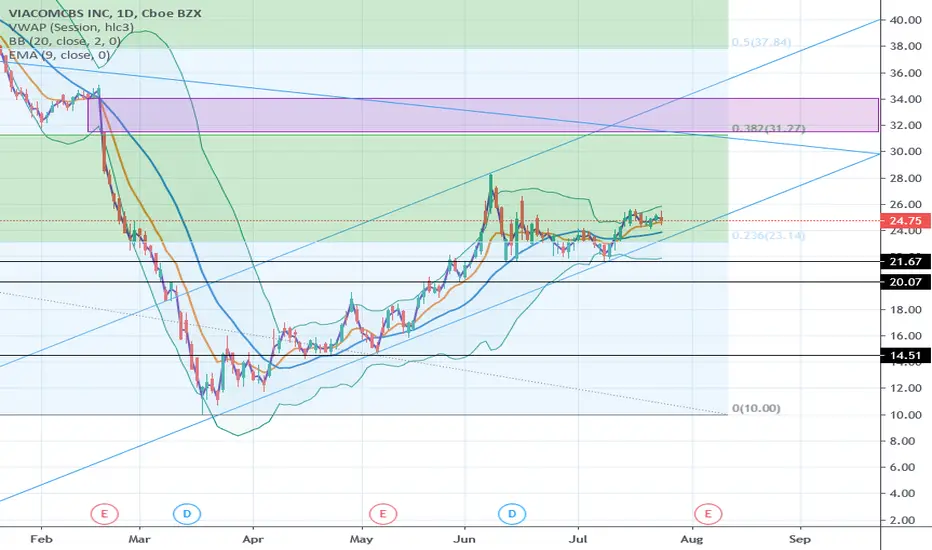
dying businessstock has been bearish for 3 years
below vwap
support at 9ema
expecting retest and break channel support
entry 21.67
stop loss 20
target >23.14-31.27
Risk/Reward -1/+2-10