CMCSA In the midst of an adjustment trend of downward direction 19-JUL
www.pretiming.com
Investing position: In Rising section of high profit & low risk
S&D strength Trend: In the midst of an adjustment trend of downward direction box pattern price flow marked by limited rises and downward fluctuations.
Today's S&D strength Flow: Supply-Demand strength has changed from a weak selling flow to a strengthening selling flow again.
Forecast D+1 Candlestick Color : RED Candlestick
%D+1 Range forecast: 0.6% (HIGH) ~ -0.9% (LOW), -0.1% (CLOSE)
%AVG in case of rising: 1.3% (HIGH) ~ -0.5% (LOW), 0.9% (CLOSE)
%AVG in case of falling: 0.6% (HIGH) ~ -1.1% (LOW), -0.4% (CLOSE)
CMCS34 trade ideas
Comcast holds great potential for the second half of 2019 COMCAST CORP. NASDAQ (CMCSA) HAS OUTPERFORMED ITS PEERS FOR SOME TIME AND HAS REWARDED INVESTORS WITH A 30% RETURN IN 2019 WHILE ALSO HAVING A HEALTHY DIVIDEND OF 2% .
INITIAL PANIC OVER THE SKY DEAL HAS EASED.
COMPANY IS HIGHLY DIVERSIFIED WITH MULTIPLE REVENUE STREAMS.
LOW VULNERABILITY TO TRADE DISPUTE.
GREAT TRACK RECORD OF DOUBLE DIGIT REVENUE GROWTH ANNUALLY.
VERY REASONABLE VALUATION.
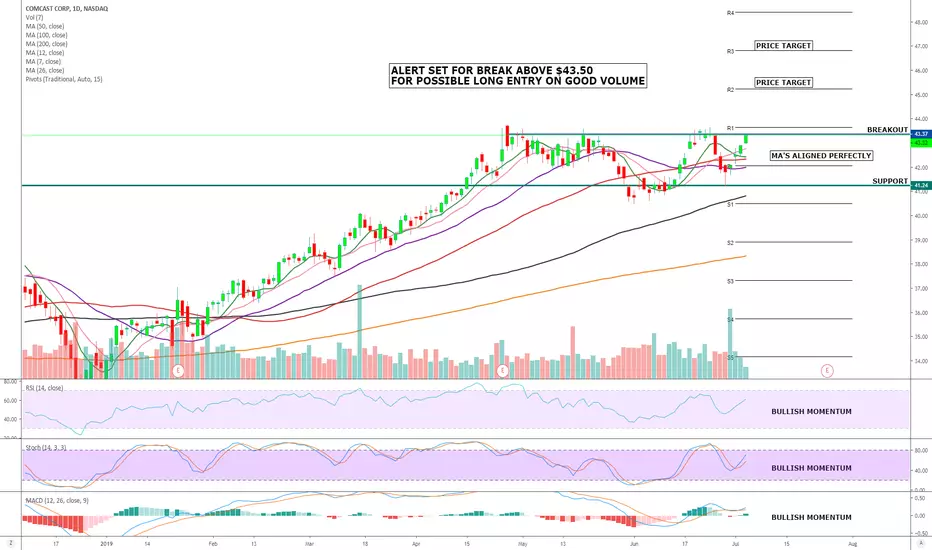
STOCK IS IN A VERY BULLISH CONSOLIDATION, BREAKOUT EXPECTED VERY SOON IF THE MARKET SENTIMENT CONTINUES TO BE BULLISH
AVERAGE ANALYSTS PRICE TARGET $48.14
AVERAGE ANALYSTS RECOMMENDATION OVERWEIGHT
P/E RATIO 16.5
SHORT INTEREST 1.5%
COMPANY PROFILE
Comcast Corp. is a media, entertainment, and communications company, which engages in the provision of video, Internet, and phone services. It operates through the following segments: Cable Communications, Cable Networks, Broadcast Television, Filmed Entertainment, Theme Parks, and Corporate and Other. The Cable Communications segment provides video, Internet, voice, and security and automation services under the Xfinity brand. The Cable Networks segment consists of national cable networks, regional sports, news networks, international cable networks, and cable television studio production operations. The Broadcast Television segment includes NBC and Telemundo broadcast networks. The Filmed Entertainment segment involves in the production, acquisition, marketing, and distribution of filmed entertainment. The Theme Parks segment consists of Universal theme parks in Orlando, Florida; Hollywood, California; and Osaka, Japan. The Corporate and Other segment includes operations of other business interests, primarily of Comcast Spectacor. The company was founded by Ralph J. Roberts in 1963 and is headquartered in Philadelphia, PA
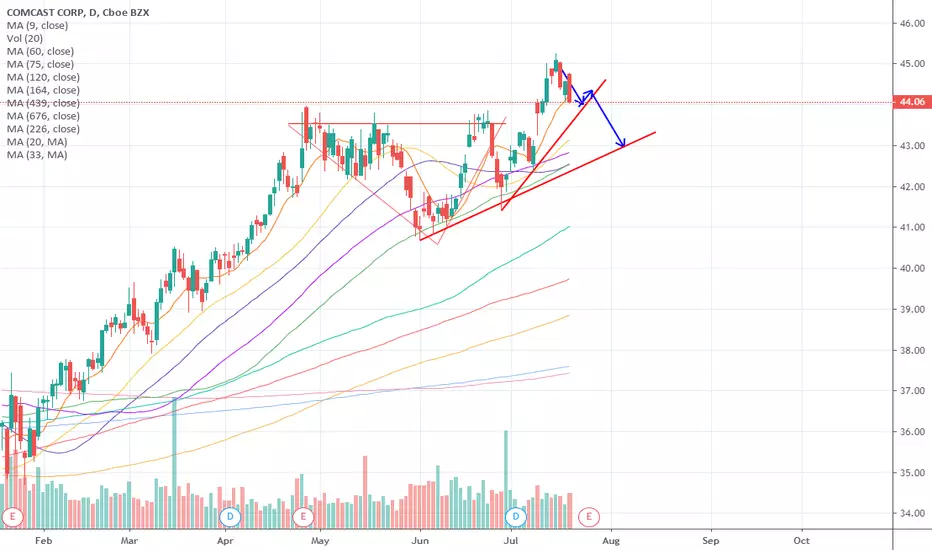
Stock Pick for Position Traders: $CMCSAAfter consistently monitoring the movement of $CMCSA, it just did a breakout from its range and is now sitting above MA20 acting as its current support, EMA10 is about to cross above MA20, while RSI is at 57 level.

CMCSA stock price forecast timing analysis.Stock investing strategies
Read more: www.pretiming.com
Investing position about Supply-Demand(S&D) strength: In Falling section of high risk & low profit
S&D strength Trend Analysis: In the midst of a rebounding trend of upward direction box pattern stock price flow marked by limited falls and upward fluctuations.
Today's S&D strength Flow: Supply-Demand(S&D) strength flow appropriate to the current trend.
D+1 Candlestick Color forecast: GREEN Candlestick
%D+1 Range forecast: 1.0% (HIGH) ~ -0.9% (LOW), 0.3% (CLOSE)
%AVG in case of rising: 1.5% (HIGH) ~ -0.3% (LOW), 1.0% (CLOSE)
%AVG in case of falling: 0.7% (HIGH) ~ -1.5% (LOW), -0.8% (CLOSE)
Stock Price Forecast Timing Criteria: Stock price forecast timing is analyzed based on pretiming algorithm of Supply-Demand(S&D) strength.

Stock Watchlist for Postion Traders: $CMCSA Potential Breakout$CMCSA is still consolidating within its range but we might see a potential breakout since it is showing above average volumes for the past trading days while RSI is at 54 level which is a good sign.

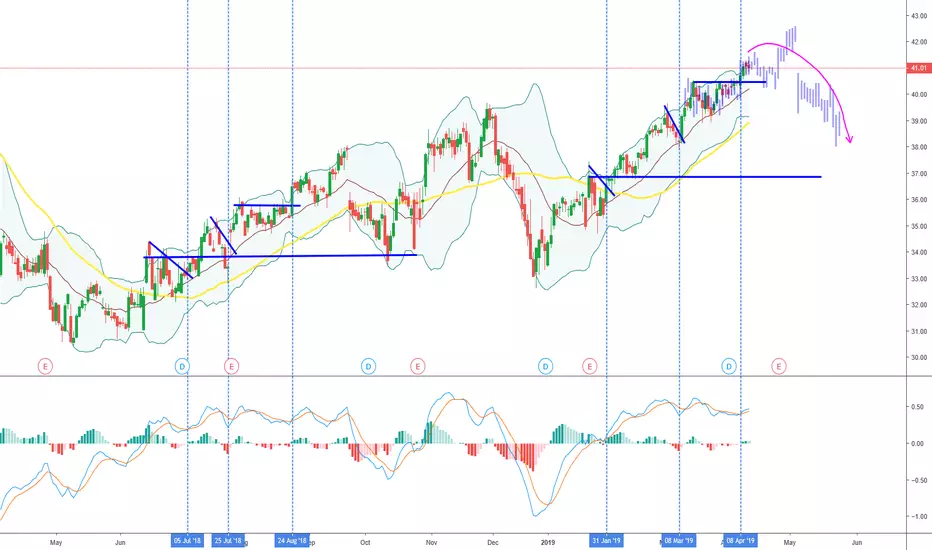
COMCAST WeeklyCurrently forming double top, if breakout to ATH target above.
If pullback target previous resistance.
If 35 is broken things looking hairy.


CMCSA (Weekly chart)We are approaching a major resistance, we can look for shorts. Wait for bearish candle to form on weekly chart and break below the 42.00 level.


CMCSA: Probably one of the cleanest breakoutReminder: This is not a high flyer but very stable company with tons of cash in hand. Sky Network will show and provide good value in their next er next week imho.
Loving this setup.

CMCSACup w Handle ? Not really, but could see a nice breakout perhaps - 40.63
Relative Strength is rising nicely since May 2018


Comcast ShortComcast
Nearing 52w high. Has been rejected on a prior test.
Tight Stop loss (1%) with a short position off of the retest.


Comcast - Waterfall possible?At the week level, a bearish engulfing has developed. After a trend, this is a sign of the trend change.
The first target area would be $ 28 on the plan. The CRV is excellent at 6 to 1. Looking, Waiting for Entry on the following Monday.


CMCSA POTENTIAL DOWNTREND CONTINUATIONCMCSA has broken the long term correction. I'm expecting one more impulsive wave to the downside.

COMCAST Bearish Mode ONThe stock dropped below the 200 and 50-day moving average. My PV is at $42 a share, but in my case, I’m already short on it and I'll wait to take some actions for a proper chance to buy around $32.83 and then take profit around $42. Wall Street is targeting this share around $43.
Learn how to beat the market as Professional Trader with an ex-insider!
Be part of an elite trading group.
Have a Nice Trading Week!
Cream Live Trading, Best Regards!

CMCSA Crossroad for nowPersonal liking aside, CMCSA is in the midst of a crossroad between utopia and dystopia :)
In an ideal world, I hope the uptrend line is supported with a break above 36.60 for more upside towards 38.17 and a longer term target of 42.
Yet in the event that it should break 34.50 then the market would have decided that it favors the downside more than my personal liking or bias.
Reflection: The key is not knowing for sure what a stock is going to do next, but knowing what it should do. Then it's just ensuring if the train is on schedule or not and adapting to the situation presented.

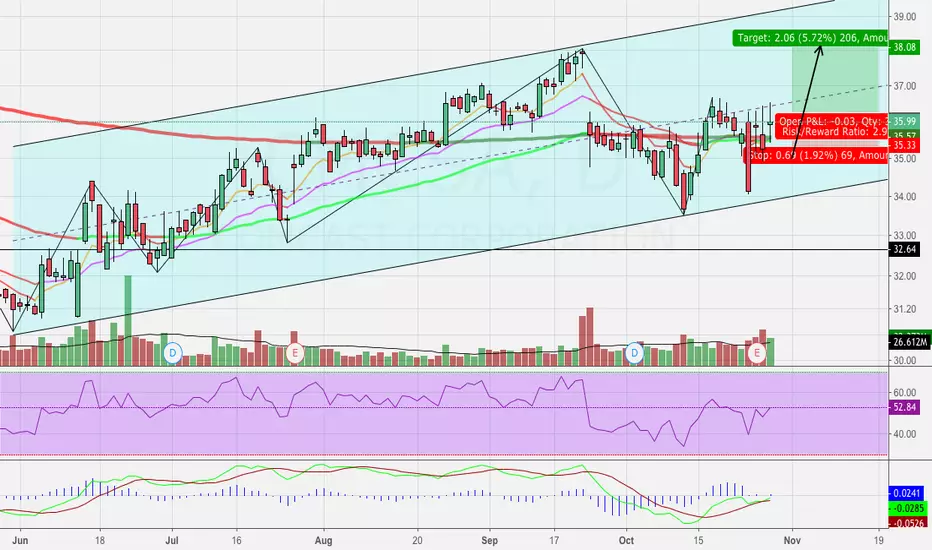
CMCSA Holding Bullish Channel SupportCMCSA is holding the medium term bullish channel support. Price target is $36.50 - $37.50 with a quick recovery during October.
The content is for informational purposes only, you should not construe any such information or other material as investment, financial, or other advice.
-Wextini
