Bottoming outNYSE:HRL has formed a large descending triangle and a potential double bottom formation. Given the upside momentum, there is a strong chance of HRL trending higher after breaking above the descending triangle.
Long-term MACD is looking at a strong long-term bullish momentum after the MACD/signal line is rising and histogram is positive.
Stochastic has been rising and is in a steady state, indicating strong bullish momentum in the mid-term.
23-period ROC is rising and staying above the zero line. Directional movement index is strong bullish.
Prices just closed above the kumo of the ichimoku, making the signal a strong bullish signal.
H1RL34 trade ideas

Hormel Foods Co | HRL | Long at $28.98Food stocks are gaining momentum. I anticipate another round of inflation could boost them in the coming 1-2 years. Hormel NYSE:HRL is trading at a price-to-earnings of 20x and pays a dividend of 4.05%. Insiders have been awarded options and are buying shares below $30. Earnings are forecast to grow 9.16% per year and the company has a very low debt-to-equity ratio (0.36x). Thus, at $28.98, NYSE:HRL is in a personal buy zone.
Targets:
$34.00
$36.00
... $50.00 (very long-term, inflationary environment, etc)

$HRLfor a 20%+ profitRSI is in the buy zone. P/E and P/B are in a beautiful buy range too. Sell once it hits the red line.

HRL approaching Monthly 200MASince an ATH of $55.11 in April of 2022, HRL has declined -47%.
HRL has never been priced below its monthly 200MA.
If HRL produces positive ERs on Thursday 2/29, it could be set up for a solid technical bounce from its monthly 200MA.
Monthly oversold RSI... If monthly 200 support ultimately fails, I'll be watching the yearly S1 pivot area as next possible support.

#HRL#Hormel Foods Corporation (NYSE: HRL), a distinguished brand in the food processing sector, has been under the lens of investors and traders alike due to its recent price actions. A meticulous examination of the technical charts reveals a narrative of a stock at a critical juncture, hinting at a potential momentum shift in the near term.
Fundamental Analysis:
In Q3 2023, HRL reported a quarterly earnings of $0.40 per share, falling short of the consensus estimate of $0.41 per share. The stock faces challenges stemming from a volatile, complex, and high-cost operating environment, with specific weakness noted in the International segment. Despite Hormel Foods' steady market presence and dividend payout, the stock's performance is hampered by operational challenges and missed earnings estimates. The analysts' hold rating indicates a neutral outlook with potential upside if the company can address its highlighted challenges and achieve its strategic targets.
Technical Analysis:
Currently, HRL is stationed at a key support level on the weekly chart, with critical support price lingering around $30. The structure unveils a complete reverse impulse wave, indicating that the stock is at the tail end of the 5th wave. Should the stock find support at S1, a price retracement could be imminent, marking the initiation of a new wave cycle. The RSI indicator delineates that the price has entered a pronounced oversold phase, traditionally a precursor to a trend reversal. However, the extremities in the RSI readings necessitate a cautious approach, as a premature entry could lead to a drawdown if the price continues to plummet. The MACD, a trend-following momentum indicator, has yet to showcase a significant reversal pattern, suggesting that the bearish momentum is still intact. A prudent approach would be to await stabilization at S1, followed by a corrective wave B, before considering an entry. This strategy aims to mitigate the risk associated with catching a falling knife while capitalizing on the potential upside once the trend reversal is confirmed.
Entry Strategy:
A conservative tactic would be to await stabilization at S1, trailed by a corrective wave B, before contemplating an entry. This strategy is devised to lessen the risk associated with catching a falling knife while capitalizing on the potential upside once the trend reversal is substantiated.
This analysis seeks to provide a holistic insight into HRL's potential future price movement, grounded in both technical and fundamental analysis. The confluence of support levels, wave structure, and momentum indicators coupled with the company’s fundamental outlook paints a picture of cautious optimism, albeit with a recommendation of a well-thought-out entry strategy to navigate the inherent market risks.

$HRL Bear Flag Weekly ChartNYSE:HRL Bear Flag Weekly Chart The technical analysis of a bear flag pattern on the weekly chart of Hormel Foods Corporation (ticker symbol: NYSE:HRL ) reveals a potentially bearish trend continuation signal. A bear flag is a price pattern characterized by a sharp downward move (the flagpole) followed by a period of consolidation marked by parallel trendlines forming a flag shape. In this case, on the NYSE:HRL weekly chart, we observe a sharp decline in the stock price followed by a period of consolidation. This pattern suggests that sellers are still exerting pressure on the stock, and the subsequent breakout below the lower trendline of the flag may indicate a further downside move in the future. Traders and investors should closely monitor this pattern, as it could signal a potential opportunity for bearish positions or a cautious approach to the stock until more confirmatory signals emerge.

Hormel Foods LongHRL long position. It looks like it's ready to move and I got the signal for long position.
Market touched a lower Lin Reg and below MACD on H4.
Confirmation on H1 to take long position with 2 TP.
Tp1 at $40.40 and 2nd at $42.
SL at $38.63.
Warning!!!!
This content should not be interpreted as financial advice

HORMEL FOODS Stock Chart Fibonacci Analysis 070423 Trading Idea
1) Find a FIBO slingshot
2) Check FIBO 61.80% level
3) Entry Point > 40.4/61.80%
Chart time frame : B
A) 15 min(1W-3M)
B) 1 hr(3M-6M)
C) 4 hr(6M-1year)
D) 1 day(1-3years)
Stock progress : A
A) Keep rising over 61.80% resistance
B) 61.80% resistance
C) Hit the bottom
D) Hit the top
Stocks rise as they rise from support and fall from resistance. Our goal is to find a low support point and enter. It can be referred to as buying at the pullback point. The pullback point can be found with a Fibonacci extension of 61.80%. This is a step to find entry level. 1) Find a triangle (Fibonacci Speed Fan Line) that connects the high (resistance) and low (support) points of the stock in progress, where it is continuously expressed as a Slingshot, 2) and create a Fibonacci extension level for the first rising wave from the start point of slingshot pattern.
When the current price goes over 61.80% level , that can be a good entry point, especially if the SMA 100 and 200 curves are gathered together at 61.80%, it is a very good entry point.
As a great help, tradingview provide these Fibonacci speed fan lines and extension levels with ease. So if you use the Fibonacci fan line, the extension level, and the SMA 100/200 curve well, you can find an entry point for the stock market. At least you have to enter at this low point to avoid trading failure, and if you are skilled at entering this low point, with fibonacci6180 technique, your reading skill to chart will be greatly improved.
If you want to do day trading, please set the time frame to 5 minutes or 15 minutes, and you will see many of the low point of rising stocks.
If want to prefer long term range trading, you can set the time frame to 1 hr or 1 day.

📉 SELL HRL TREND CONTINUATION 🥫#HRL has created a Daily bearish flat with trend continuation setups on the lower degree at the presumed end of the C wave.
These are great entries for jumping in on the start of a large wave.

Hormel Foods: Bullish Deep Crab with Bullish DivergenceHormel Foods is trading within a Falling Wedge as it Bullishly Diverges at the PCZ and the Earningss Date approaches.
There is also a Bullish Piercing Line on the Daily right now.

HRL: LT Short OppHRL appears to be completing a three drives pattern on the monthly. It's hasn't seen its monthly 200 SMA in forever, literally. Insiders are happy to sell to you. It's consolidating tightly between the 20 and 50 EMAs. A break below 44 would be the signal. First target 39 then 36 and 30. After the break of 44, stop would be a weekly close above 46.


HORMEL FOODS PRICE FORECASTIn this forecast im sharing my short perspective of HRL while
i see all the prior packaged foods consumer defensive going long
I see resistance from the trendline as well as the level where it lies
as for the rest strategy secret
SENNA SEASON

$HRL with a Bearish outlook following its earnings #Stocks The PEAD projected a Bearish outlook for $HRL after a Negative Under reaction following its earnings release placing the stock in drift D with an expected accuracy of 80%.


$HRL with a Bearish outlook following its earnings #Stocks The PEAD projected a Bearish outlook for $HRL after a Negative Under reaction following its earnings release placing the stock in drift D with an expected accuracy of 77.78%.
$HRL with a Bearish outlook following its earnings #Stocks The PEAD projected a Bearish outlook for $HRL after a Negative Under reaction following its earnings release placing the stock in drift D with an expected accuracy of 75%.
Short scalp HRLShort scalp $HRL .Based on its downtrend, regress off resistance and a familiar chart pattern confirmed by my technical indicators, I expect at least half a percent in profits IF breaches today's low of $47.06 during tomorrow's session.

$HRL with a Bullish outlook following its earnings #Stocks The PEAD projected a Bullish outlook for $HRL after a Positive Under reaction following its earnings release placing the stock in drift A with an expected accuracy of 60%.

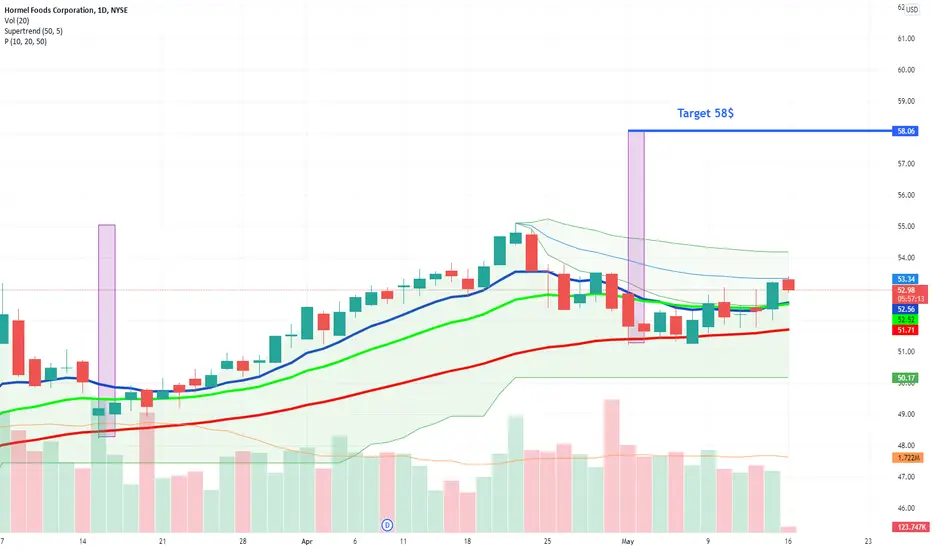
5/4/2022 NYSE (HRL)Buy (Entry Price) above the black line and exit (Stop Loss) below the red line. Can take profit at the suggested Target Price.
Entry Price: $51.77
Target Price: $52.20
Stop Loss: $51.04

There's No 'Spam' In This ChartHormel Foods is on a tear. After being trapped under 43.54 for a few sessions it ripped higher blowing right through the most significant of the Aspen S/R Levels (Purple) and went right Red @ 48.84.
Use any consolidation or pull-backs to go long with an upside target at 51.07
FYI: all the lines on this chart have been here all year - no drawing in lines after the fact. Note how 45.93 had been pivotal all year.
---------------------
In Trading, Objectivity Trumps Subjectivity
“Every trader is a steaming hot bowl of bias stew and must maintain self-awareness and lucidity behind the screens as the trading day oscillates between boredom and terror.”
The above quote is from a good friend of mine and veteran FX trader Brent Donnelly. It completely nails the biggest challenge for new and even experienced traders: being as objective as possible when making trading decisions.
Yes, as you become more experienced, subjectivity, market feel and experience are part of one’s decision-making matrix, but early on you do not have that luxury.
If you start each day knowing that price action in the market is random it will remind you to think objectively. There are, however, repeatable patterns that occur again and again…..it’s your job to identify them.
That’s where Support & Resistance levels come in.
Definitions: “Support” and “Resistance” Levels
Many technical indicators and tools can be subjective and challenging to learn. This is not the case with support and resistance levels.
Support and resistance are terms for two price levels on a chart that appear to limit the security’s range of movement.
The “support level” is where the price regularly stops falling and bounces up.
The “resistance level” is where the price normally stops rising and dips back down.
The more frequently a price hits either level, the more reliable that level is likely to be in predicting future price movements.
Understanding Support and Resistance Levels
Remember, the more informed and objective we can be with numbers, the more confident we can be with our trades. That’s important because, although price action is random (a fact that has been proven time and time again), there are repeatable patterns we can use to get an edge.
Two of those objective data points we can use to gain an edge are support and resistance levels. These are two of the best tools we have when it comes to swing trading. Why? Because they give us strong data points that suggest where an instrument is likely (and unlikely) to go.
But this is really key: Arbitrarily cataloging each price level that appears to be relevant as a support or resistance level isn’t going to get you far. That’s why Aspen Trading takes a unique approach to support and resistance levels.
With Aspen’s Support & Resistance Levels, we measure where trades (prices) occur in terms of frequency. This gives us a sense of where market participants are wagering prices may go.
That’s about as raw and unfiltered as you can get in terms of displaying what has taken place. There’s no room for interpretation - this is raw data that can be used to get a sense of where prices may be heading.
Learning The “Four Sets” of Support and Resistance Levels
There are four sets of support and resistance levels that are part of Aspen Trading’s S/R framework.
Each set of support and resistance levels is unique to a specified period of time. We display each of them in different colors on our charts when we analyze trades to make it easy for us to understand the data as we get comfortable reading charts.
You’ll see each of these levels on display in the charts that follow below. The four sets of support and resistance levels are classified as follows:
There are four sets of support and resistance levels that are displayed by Aspen Trading’s S/R Analysis Tool. Each one is unique to a specified period of time that we then display directly on the chart. The levels are classified as follows
- Intra-day & short-term traders love the GREEN levels
- Swing traders gravitate towards the ORANGE levels
- Medium-term traders like to see RED
- And those longer-term folks dig PURPLE
IMPORTANT:
These lines will change/adjust until the end of the specified observation period is complete.
Once the observation period is complete, that range will then be displayed on the chart as a set of dotted lines that is shaded in to serve as a reference point for traders to know the key levels from the prior lookback period. This can often be very helpful.
What’s the distinction between the 4 color levels?
Essentially think of these levels on a rising scale of importance. While GREEN levels are certainly key, they do not hold the same level of significance as the PURPLE levels.
Twitter

HRL Long Tis The SeasonHRL goes up every December! Hormel Foods Corp. engages in the production of meat and food products. It operates through the following segments: Grocery Products, Refrigerated Foods, Jennie-O Turkey Store, and International and Other.
The Chart speaks volumes!
