Beer is a king right nowEntry price – 42.43 $.
TP1 – 42.93(+1,18%), TP2 – 43.91(+3,48%), TP3 – 44.48(+4,81%). SL – 41.77(-1,59%).
M1CB34 trade ideas

$TAP breaking out of ascending wedgeSetup with breakout of wedge on MACD positive divergence could find higher levels with structure maintained. Will need for this to stay above channel in order to maintain its reversal potential.

TAP, Molson Coors Beverage Company - Potential breakoutNYSE:TAP
Great potential double bottom on Molson Coors Beverage Company.
As you can well see the two lows have equal distance from the middle peak valley and any breakout of this level would clearly guide us to enter Long.
As you can see, patience in finding the patterns together with not forcing the operation but rather letting the profitable positions run and quickly closing the loss-making ones lead to a constant growth over the years.
Please set the alerts and enter with the right timing.
Stay Tuned!

A long term look at $TAP Compared to the other major alcohol stocks (except maybe $ABINBEV), $TAP appears to have the best long potential.


TAP - SOLD!!! Bought @ $56 / Sold @ $57 no fun there... lolTAP - SOLD!!! Bought @ $56 / Sold @ $57 no fun there... lol


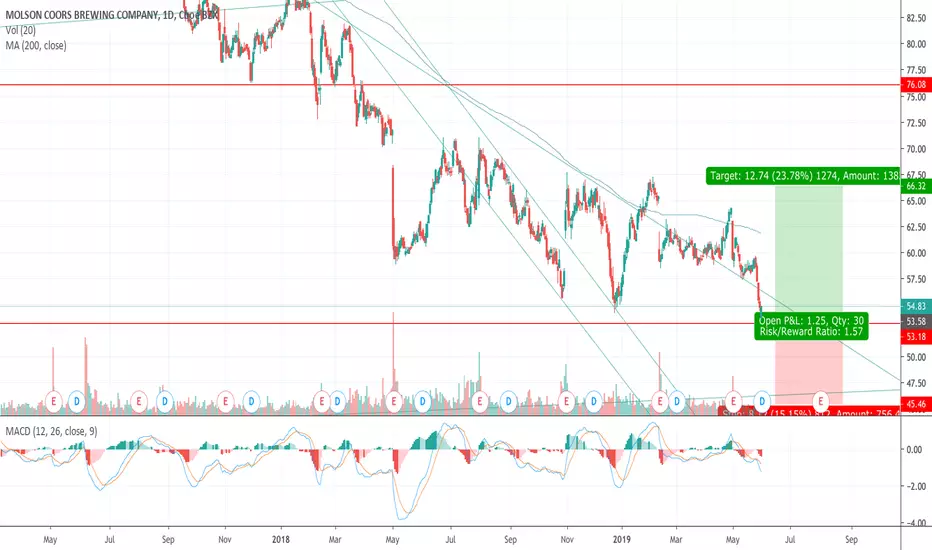
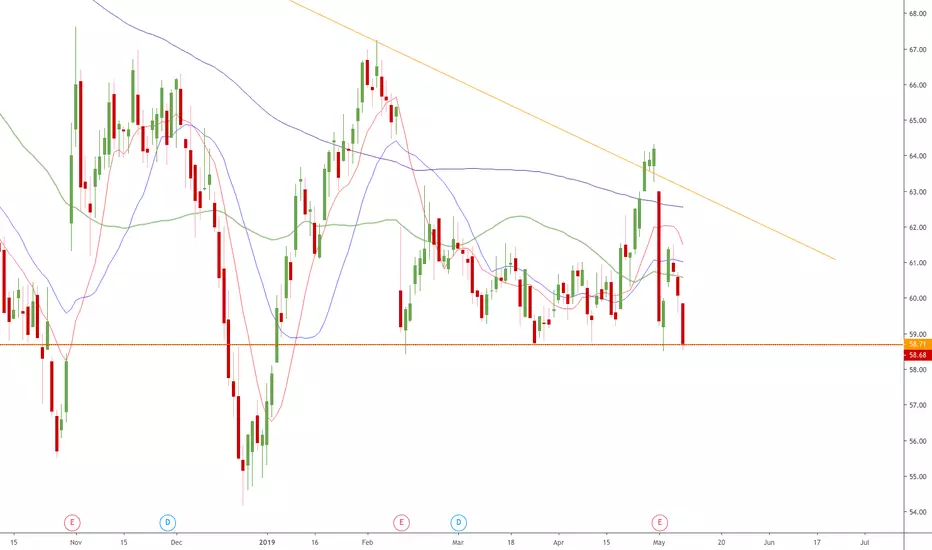
TAP Short IdeaNYSE:TAP
Short position on TAP below 58.71?
Declining 200 and 50 Day SMA .
Below YTD VWAAP (not shown)

TAP. Buy now or just wait?Long-term/Position trading. The stock price down from $110 to $55 with almost no significant correction, but now I see that the price has reached an important level somewhere between $50-60 + a really good trend line. so, is it a perfect time to buy for long-term?

TAP unable to break out of downward price channelCurrently NYSE:TAP has been trading in a downward trend since the peak in October 2016. There looks like a potential double bottom for a price reversal but if the stock breaks down below the $55 it could be heading to the next level of support at $51 or $47.
News about the class action lawsuit for misreporting on financial statements finance.yahoo.com
the corn syrup in your beer ads
and continued price similarity with smaller craft beer companies
will continue the downward pressure.

TAP molson coors potential bearish shark patternTAP has all the requirements to be a a bearish shark harmonic pattern except for point D has not been met yet. TAP has also broken out of its 2016 downward channel after making a double bottom. The neckline of the double bottom is currently being tested as confirmation. Plenty of momentum on the weekly timescale for TAP to continue to point D. A short sell at point D with a tight stop loss provides the best r:r of the harmonic pattern.

TAP breaking over resistanceTAP just broke over a heavy resistance. Price action alone is bullish. Have earnings coming up soon. If they are at all positive this is going to jump.

$TAP - The trading system Equity Trend to go short todayToday at the market open (Dec 31), the equity trading system Equity Trend will open a short position in Molson Coors Brewing (ticker: TAP)
Each day, the system scans around 10,000 stocks to find just 1 or 2 which are ready to move immediately.
The system combines elements of breakout trading, trend following and risk management from Turtle trading.
System: bit.ly


Buy signal on coors 4hrCoors 4hr chart has offered a regular bull divergence, targets are on the fib levels on the chat, lets see how it plays out

Will beer run on Kavanaugh confirmation?This is certainly a super speculative short-term play (returns to be had Monday if it plays out), but if you saw the Kavanaugh hearing where he defended himself... well, then you'll know why I'm serious and this is not just a joke! ha

BUY! BULLISH INDICATORS!Weekly chart looks great!
Indicators are turning up (POSITIVE) / (BULLISH)
RSI is about to turn / close above 50 mid line BULLISH! MACD is turning Positive and Stochastics are turning up!
I also noticed on the weekly chart, accumulation might be turning Positive and On Balance Volume has turned Positive!
Although it's trading under the cloud, I think it is a great entry point specifically when I see nothing negative surrounding the sell off.
Many times, buying under the cloud can turn you a huge profit because the stock either sold off with the market or the stock is on its way back up after being over sold.
Position: 20,000 SHARES
PRICE: $68.85
DISCLAIMER
No RELIANCE-ON
Accordingly, I will not be liable, whether in contract, tort (including negligence) or otherwise, in respect of any damage, expense or other loss you may suffer arising out of such information or any reliance-on you may place upon such information I have posted. Any arrangements between you and any third party contacted via the Website are at your sole risk.
PLEASE DO YOUR OWN RESEARCH BEFORE INVESTING
Best of luck folks!!

TAP entered longBought along the bottom rising trendline. RSI oversold at 30 on 6month chart and showing signs of a buy with a reversal of the 50 and 100ema. Expecting at the least a bounce.
