Sitting on supportWBA is sitting on support. Wait for dust to settle. If 59 breaks, it will go down. I believe Amazon entrance is over done and it will recover.
WGBA34 trade ideas


WBA replaces to GE on Dow Jones 30Walgreens WBA replaces to General Electric GE on Dow Jones Industrial Average.

WBA - Bullish Cup & Handle PatternHow can you make money on WBA? Charts have all of the answers on them, do not make things more complication then they have to be. I would let price action get done to $63.00 or trade sell side, then be bullish afterward.

Buy this amazing stock pleaseI would buy here and then sell here, it will be very profitable according to my brain

WBA - Naked Put (Bullish) OptionSymbol: WBA
Current Price: $67.59
Option:
Write
Option: 6th Apr $66.50 Put
Price Per Option: $ 0.61
Contracts: #35 x 100
Total cost: $2,135
Estimated Returns - WBA at $67.59 on 28th Mar 2018
Entry cost: $2135 (net credit)
Maximum Risk: $230615 at a price of $0.05 at expiry
Maximum Return: $2135 at a price of $68.50 PLUS on day 6th Apr 2018
Break evens at expiry: $65.90


SELLING AT 80.00 IS THE SAFEST .SELLING AT 80 .is my best shot. and then buy once market opens moves and drops .
share commetns or thoughts, please and thank you

WBA in uptrend channel about to test major resistanceNASDAQ:WBA
Stop entry if $76 resistance is broken


Walgreen: Short Now, or Wait for a Breakout? Support/Resistance A breakout above the blue overlay line would confirm a bullish posture


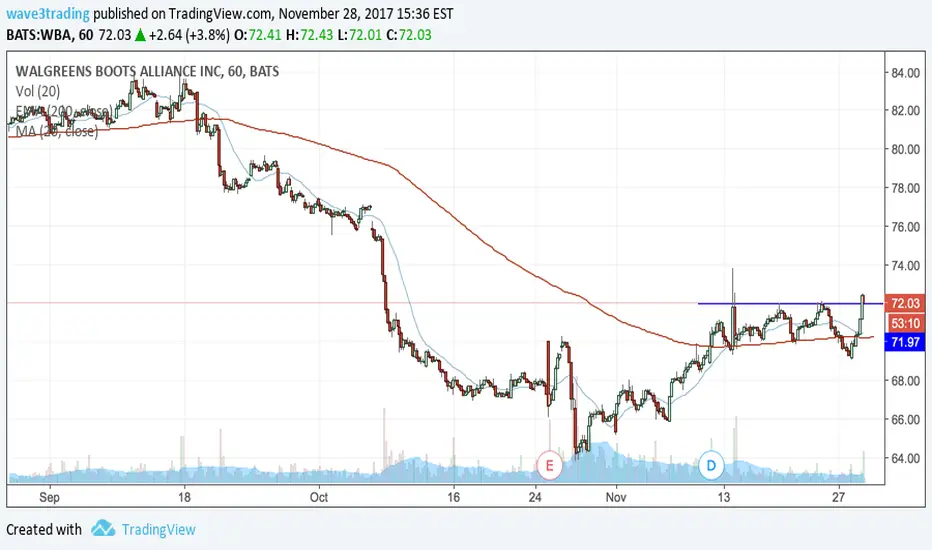
WBA sinks to a new low on Amazon industry threatReports that Amazon.com has received wholesale pharmaceutical licenses in 12 states has put pressure on the drug store sector today. WBA shares have been under pressure for about a month with channel support near $76.00 and $72.00 having failed already. The shares have approached $64.00 a potential measured support level with next measured move support possible near $56.00 should the initial test fail.

Set long position on WBAAfter a sustained downfall, Walgreens is going up.
The three indicators (ADX & DI, MACD and Stochastic) shows strong signals of a long position.
-ADX & DI: The ADX line is above the 25 line giving a strong signal and the DI+ DI- has crossed.
-MACD: The histograms shows signals of a long position and the two lines are going up and also has crossed. NASDAQ:WBA


Another WBA Trade!! Deadly Accurate!Hey Traders, We have another WBA trade. I have highlighted some of my most recent trades on WBA. There is a lot of institutional traders present in WBA, and we can gauge where they are most likely to be putting there money next. Those of you who have been following these trades know that they have been very accurate and educational. My most recent idea on WBA (Linked below) was a "Home run" Trade and I explained in that idea how managing expectations was crucial to successful trading. The idea that I published before that was a good test of patience because it took longer than we had expected so there is a lot to learn from these trades and I would like to continue publishing them if others feel they have been helpful. I have Re-entered into a Long Position on Wba.
Entry- $80.80
Target 1- $83.20
Target 2- $86.00
Stop- $78.00
I may trail stops on this trade after target 1 is hit. I will be sure to keep you up to date on how this trade plays out as I am sure there is going to be a lot to learn from it. This is a Swing trade and can take weeks to fulfill Targets. Thanks Traders, I hope this was helpful.

WBA potential trade setuplong term trend is trending down finding support at 80.21
looking to play for a mini breakout short term
ascending triangle on intermediate time frame
increasing positive volume pressure/ increasing relative strength
measured move up to around 82.32 resistance area
risk reward ratio= 3.25 stop at 81.15
remaining cautious as longer trend is to the down side

Deadly Accurate WBA Trade! 80+ % Win Rate!Hey Traders, I recently entered another WBA trade. My Entry price was 86.00 but I do see plenty more entry opportunities before this move plays out.. This is a Swing trade that has been extremely profitable for me. These trades can take up to a month or so to hit targets given the fact that price needs to move nearly $5 to hit target 2.
Entry- $86.00
Target 1- $84.00
Target 2- $81.50
If price can come back up to 85.30, I may add to the position. I will be sure to update this idea as the trade plays out. Thanks traders and feel free to leave a comment or any questions you may have regarding this setup.
Also, I am trading options on this ticker not shares.
I bought Jul 21 2017 $85 Long Puts!!


Near-Term Drop For WalgreensWalgreens Boots Alliance stock has been in a defined bullish trend since the beginning of 2016. Its current position displays the stock is ready to cycle down. The typical movement occurs over a period of 15 or more trading days.
When we take a look at other technical indicators, the relative strength index (RSI) is at 62.2076. RSI tends to determine trends, overbought and oversold levels as well as likelihood of price swings. I personally use anything above 75 as overbought and anything under 25 as oversold. The current reading declares the stock has is moving down as this indicator recently turned downward when it was near overbought territory. The last two time the stock was at its current RSI level, the stock dropped greater than 7% over the following 32 trading days.
The true strength index (TSI) is currently 11.6581. The TSI determines overbought/oversold levels and/or current trend. I solely use this as an indicator of trend as overbought and oversold levels vary. The TSI is double smoothed in its calculation and is a great indicator of upward and downward movement. The current reading declares the stock is trending upward. This indicator is more indicative of long term trend and it is slow to reverse course.
The positive vortex indicator (VI) is at 1.1647 and the negative is at 0.7472. When the positive level is higher than 1 and higher than the negative indicator, the overall price action is moving upward. When the negative level is higher than 1 and higher than the positive indicator, the overall price action is moving downward. The current reading declares the stock was moving up, but this is beginning to weaken and trend downward.
The stochastic oscillator K value is 53.7979 and D value is 63.7308. This is a cyclical oscillator that is highly accurate and can be used to identify overbought/oversold levels as well as pending reversals and short-term activity. I personally use anything above 80 as overbought and below 20 as oversold. When the K value is higher than the D value, the stock is trending up. When the D value is higher that the K value the stock is trending down. The current reading declares the stock exited overbought territory and should continue to decline.
Considering the moving average crossover, RSI, TSI, VI and stochastic levels, the overall direction appears to be pointing down. Based on historical movement compared to current levels and the current position, the stock could drop at least 3.5% over the next 28 trading days.

