FXCCAD is a winner in the upcoming roll-a-coaster. Let's go through the facts a strong economy and a "stable" geopolitical region should go well through all the threats ahead of us in 2022 and 2023.
Key stats
About INVESCO CCY SHS CDN DLR TR CDN DLR SHS ETF
Home page
Inception date
Jun 21, 2006
Structure
Grantor Trust
Dividend treatment
Distributes
Distribution tax treatment
Ordinary income
Income tax type
Ordinary Income
Max ST capital gains rate
39.60%
Max LT capital gains rate
39.60%
Distributor
Invesco Distributors, Inc.
FXC provides direct exposure to the Canadian currency by holding physical Canadian dollars in a JPMorgan deposit account. This simple structure allows the fund to closely track the CAD/USD spot exchange rate. FXC is fit for investors interested in accessing the Canadian dollar without the hassles of a separate foreign exchange account. Still, investors should note that: 1) there's no deposit insurance on its holdings, so it carries credit risk of its depository, JPMorgan, and 2) distributions and share sales are always taxed at ordinary-income rate, regardless of holding period.
Classification
Geography
Canada
What's in the fund
Exposure type
Cash
Bonds, Cash & Other100.00%
Cash100.00%
Top 10 holdings

FXC - Bull Run - Higher LowsSo I bought some cheap 200-day call options already at the money just before the BoC announced they were holding the rates steady of 1.75%. This is against a US fed already doing QE and cutting rates will prove bullish for the CAD. We obviously will see with time, but this market looks good for comm
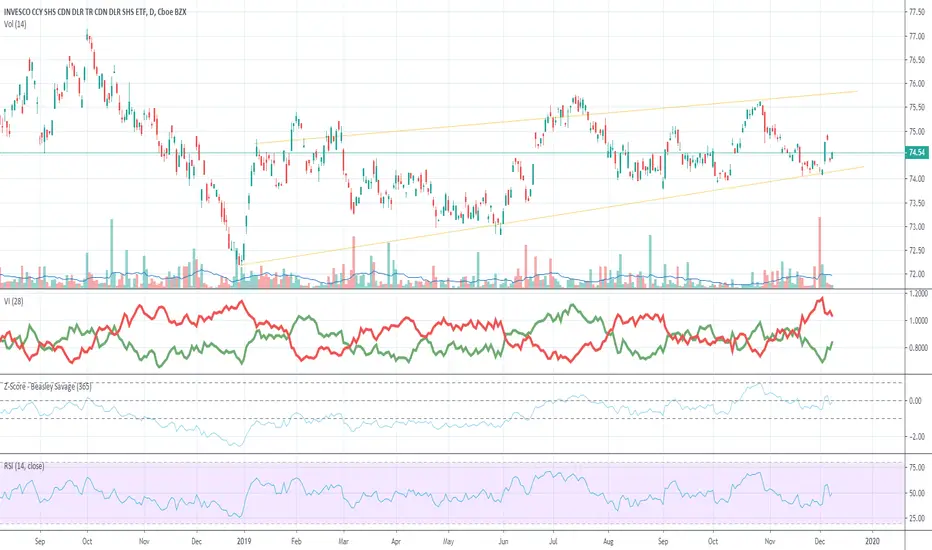


Rob Smith - smithintheblack - Quant Edge learning11/26/17 – Bias: Neutral. Conflicted with inside month
of November, inside month up, and outside up week.
4 inside weeks within the bearish month
of August. Week of 11/20, Outside week up. We will
must wait and see what actionable signals December
Brings. A move over 77.86, I would be bullish, and


PROJECT 1001 PIPS - MEDIAN LINE - DIVERGENCE GroupThis is the Group description for the Median Line/Divergence based set ups. Please refer to the notes and the comments.
To sign up for this group
Enter your detail here: goo.gl

Canadian Dollar temporary strength You can see the clear levels as prices dropped and are now rising towards the sell zone. I'm long at this bottom edge of consolidation and will exit at the red line, then reverse and short it.

See all ideas
Summarizing what the indicators are suggesting.
Oscillators
Neutral
SellBuy
Strong sellStrong buy
Strong sellSellNeutralBuyStrong buy
Oscillators
Neutral
SellBuy
Strong sellStrong buy
Strong sellSellNeutralBuyStrong buy
Summary
Neutral
SellBuy
Strong sellStrong buy
Strong sellSellNeutralBuyStrong buy
Summary
Neutral
SellBuy
Strong sellStrong buy
Strong sellSellNeutralBuyStrong buy
Summary
Neutral
SellBuy
Strong sellStrong buy
Strong sellSellNeutralBuyStrong buy
Moving Averages
Neutral
SellBuy
Strong sellStrong buy
Strong sellSellNeutralBuyStrong buy
Moving Averages
Neutral
SellBuy
Strong sellStrong buy
Strong sellSellNeutralBuyStrong buy
Displays a symbol's price movements over previous years to identify recurring trends.