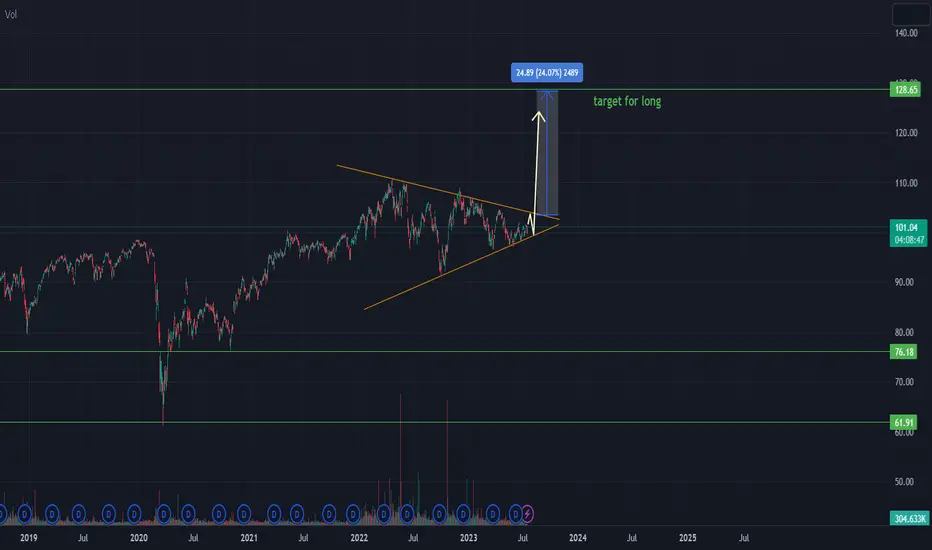
HDV long positionOn the chart we can see a bullish pennant formation. We expect the price will increase soon.
Our strategy is entering long position once the price breaks upper the resistance line.
Target for long is shown on the chart.
Key stats
About ISHARES TRUST ISHARES CORE HIGH DIVIDEND
Home page
Inception date
Mar 29, 2011
Structure
Open-Ended Fund
Dividend treatment
Distributes
Distribution tax treatment
Qualified dividends
Income tax type
Capital Gains
Max ST capital gains rate
39.60%
Max LT capital gains rate
20.00%
Primary advisor
BlackRock Fund Advisors
Distributor
BlackRock Investments LLC
HDV offers complex high-dividend yield exposure in an ETF wrapper. Eligible securities must pass two Morningstar proprietary screens, each designed to ensure sustainability. The first is the presence of an economic moat something that sets the firm apart from its peers. This helps the fund weather downturns. (The MOAT ETF uses this approach without the high-dividend yield focus.) The second is a forward-looking comparison of assets to liabilities. REITs are excluded. HDV targets 75 stocks by dividend yield. Stocks are weighted by the total dollar amount of dividends paid rather than yield. It is perhaps this last step that gives the fund it bias towards larger firms, while the sum total of all the steps produces unique sector biases. In all, HDV delivers a high-yield play with robust sustainability screens. The index undergoes quarterly rebalance and reconstitution.
Classification
What's in the fund
Exposure type
Consumer Non-Durables
Health Technology
Energy Minerals
Utilities
Finance
Stock breakdown by region
Looking back at Equity Factors in Q2 with WisdomTreeMarkets in Q2 2022 continued to suffer from entrenched inflation and aggressive rate hikes from central banks. They also reacted to the slowdown of the global economy and the increased risk of a recession in developed economies. These changing market conditions impacted equity factors differently.

Defensives vs SPY 2022XLU, HDV and SPY performance for 2022. Defensive plays outperformed SPY so far.

$HDV 2021-JUN-22$HDV has broken below the rising trend, however has bounced above the cut line. Worth watching.

See all ideas
Summarizing what the indicators are suggesting.
Oscillators
Neutral
SellBuy
Strong sellStrong buy
Strong sellSellNeutralBuyStrong buy
Oscillators
Neutral
SellBuy
Strong sellStrong buy
Strong sellSellNeutralBuyStrong buy
Summary
Neutral
SellBuy
Strong sellStrong buy
Strong sellSellNeutralBuyStrong buy
Summary
Neutral
SellBuy
Strong sellStrong buy
Strong sellSellNeutralBuyStrong buy
Summary
Neutral
SellBuy
Strong sellStrong buy
Strong sellSellNeutralBuyStrong buy
Moving Averages
Neutral
SellBuy
Strong sellStrong buy
Strong sellSellNeutralBuyStrong buy
Moving Averages
Neutral
SellBuy
Strong sellStrong buy
Strong sellSellNeutralBuyStrong buy
Displays a symbol's price movements over previous years to identify recurring trends.