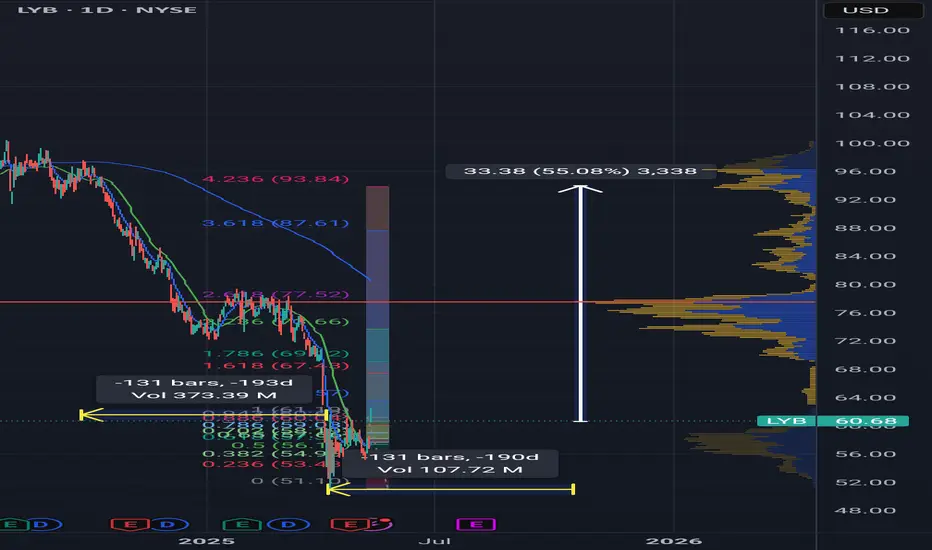
55% return by Q4 2025Using the volatility of the bottom reversal as a basis for a Fibonacci extension range, and using the date range from bottom to the previous time the asset reached the 4.236 around $93, I forecast this asset to find $93 again in late October for about a 55% return from today.
LYB/N trade ideas
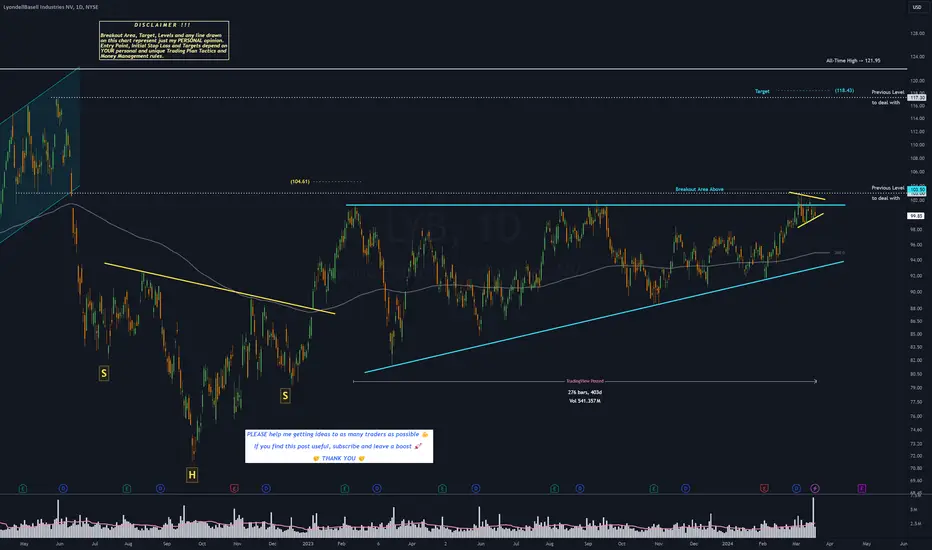
LYB - 13 months ASCENDING TRIANGLE══════════════════════════════
Since 2014, my markets approach is to spot
trading opportunities based solely on the
development of
CLASSICAL CHART PATTERNS
🤝Let’s learn and grow together 🤝
══════════════════════════════
Hello Traders ✌
After a careful consideration I came to the conclusion that:
- it is crucial to be quick in alerting you with all the opportunities I spot and often I don't post a good pattern because I don't have the opportunity to write down a proper didactical comment;
- since my parameters to identify a Classical Pattern and its scenario are very well defined, many of my comments were and would be redundant;
- the information that I think is important is very simple and can easily be understood just by looking at charts;
For these reasons and hoping to give you a better help, I decided to write comments only when something very specific or interesting shows up, otherwise all the information is shown on the chart.
Thank you all for your support
🔎🔎🔎 ALWAYS REMEMBER
"A pattern IS NOT a Pattern until the breakout is completed. Before that moment it is just a bunch of colorful candlesticks on a chart of your watchlist"
═════════════════════════════
⚠ DISCLAIMER ⚠
The content is The Art Of Charting's personal opinion and it is posted purely for educational purpose and therefore it must not be taken as a direct or indirect investing recommendations or advices. Any action taken upon these information is at your own risk.
LYB - Waiting Pullback to Join the TrendNYSE:LYB is in a good momentum for the upside.
This trade is an opportunity to join the trend and take a quick profit.
1st target: 2:1
2nd target 5:1
This is a one time try trade. Price hit stop loss, I won't try it again, even if price goes back up.

$LYB with a bullish outlook following its earnings #StocksThe PEAD projected a bullish outlook for $LYB after a positive under reaction following its earnings release placing the stock in drift A with an expected accuracy of 80%.

$LYB with a Bullish outlook following its earnings #Stocks The PEAD projected a Bullish outlook for $LYB after a Positive over reaction following its earnings release placing the stock in drift B with an expected accuracy of 100%.

27/5/2022 NYSE (LYB)Buy (Entry Price) within the buy zone area and exit (Stop Loss) below the red line. Can take profit at the suggested Target Price.
Entry Price: $109.44 / $108.51
Target Price: $110.85 / $109.95
Stop Loss: $107.09

$LYB with a Bullish outlook following its earnings #Stocks The PEAD projected a Bullish outlook for $LYB after a Positive over reaction following its earnings release placing the stock in drift B with an expected accuracy of 100%.
22/3/2022 NYSE (LYB)Buy (Entry Price) above the black line and exit (Stop Loss) below the red line. Can take profit at the suggested Target Price.
Entry Price: $105.11
Target Price: $107.19
Stop Loss: $101.64

LYB - LongWaiting for confirmation of price action to break trend lines (red line). Their gas division has created a beautiful set up for a breakout that is being held back by the delay in the chemical sectors' breakout.

17/3/2022 NYSE (LYB)Buy (Entry Price) above the black line and exit (Stop Loss) below the red line. Can take profit at the suggested Target Price.
Entry Price: $100.96
Target Price: $103.15
Stop Loss: $97.31

LYBLinked previous idea. Monday open should show a fake out of break out of the smaller downward channel. Solid looking weekly candle but this is all accumulation time to me.

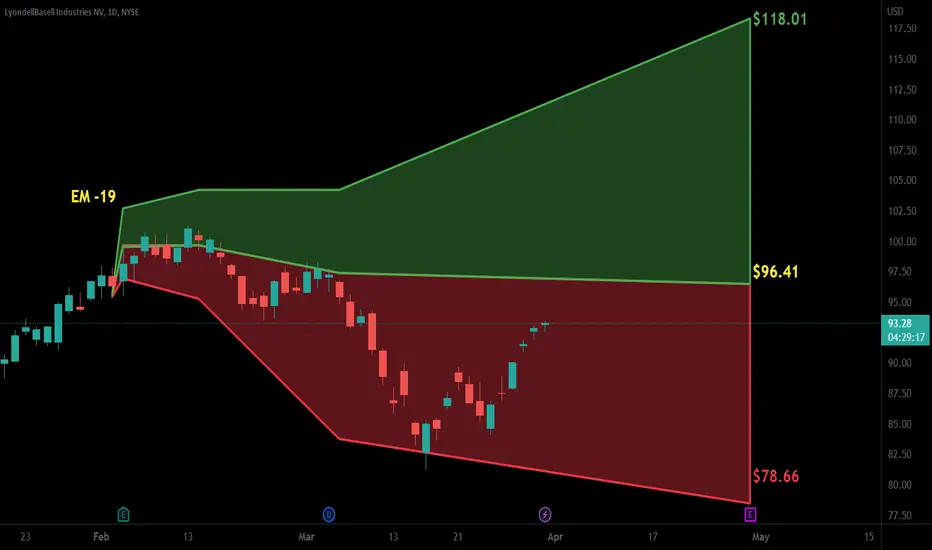
Trading template for LYB | Full explanationToday, we will take a look at LYB . We can see the price has been moving inside a correction for the last 195 days, and the structure is clear enough to understand its more external limits.
The way I thought this scenario was like this. How many times in the past were similar situations like the current one, and the next question is can I observe a pattern so I can trade?
The answer is: This has happened several times in the past, and yes, there is a clear pattern that I can wait for. Let me show you:
The explanation here is: First we need a big structure (which we already have), then we want to see a breakout followed by a 15 days correction) IF that happens, we want to see the first breakout of that followed by a candlestick below that breakout movement, and at that moment, we set bullish pending orders on the new local high with the stop loss on the previous low. The expected risk to reward ratio on this is 2.5, and based on the previous examples, we had 2 profits and 1 break-even.
What happens if the filter is never fulfilled?: We don't trade ;)
What happens if the filter is fulfilled, your setup is executed, and then the price goes directly to the stop loss:? I lose 3% of my trading capital, and I keep executing as emotionless as possible :D
It's important to show that by doing this, I can eliminate all the emotions from this execution, and by doing that, I can follow my plan without changing things on my strategy. One of the main reasons people are not able to achieve consistency is not because they don't have a good system but because they are not able to follow it (trading psychology)
Thanks for reading! Feel free to share your view and thoughts in the comments.


LYB. Must be this tall to ride this rideBelow the 200 par sars showing in the sky and macd fall below the signal is a clear sign that LYB is a little short.
The $95 puts for 8-20 are still nice and cheap. Looking for a price Target of $92. I’ll be buying 3 contracts selling 1 at $95. The next one at $92. And I’ll let the other one ride to $91 if the stock gods are amicable


LYB have upsideLYB doing quite bad comparing to other materials, but still have 12-15% upside until market decides what goes next

One of my favorite trades of the year. LyondellBasell 5.46% DivCash flow and debt to equity is not ideal, and earnings are not growing to well, as the gross margin is 6.8%. What I like is that these gains actually make it to us shareholders though. Long, or at least add it to your watchlist.


LYONDELLBASELL INDUSTRIES OfferHey investors, LYONDELLBASELL INDUSTRIES is in a fake bearish configuration with sell volume at the end of the session and bearish hammer candle has been forming. But this hides a bullish acceleration, she wants to make a reversal in a bullish acceleration gap see TIMEFRAME 1 min.
Strong possibility of breaking out the consolidation zone to go to the next high, after seeing how the buyers will manage to pass above the bullish gap.
Please LIKE & FOLLOW, thank you!

This is for me only, I am a beginner P/E = 7.75
RoA = 12.51%
RSI (M) = 40 lowest
Div Yield = 5.66%
If all goes well, the target for the long term plus all the div collected will be at 114. (Long Term). About three years from now!
