OIH MOVE TO 85% SHORT MARKET HEAD &SHOULDER TOP .786I AM moving to puts for jan in OIH AT THE MARKET MAJOR PEAK
OIH trade ideas

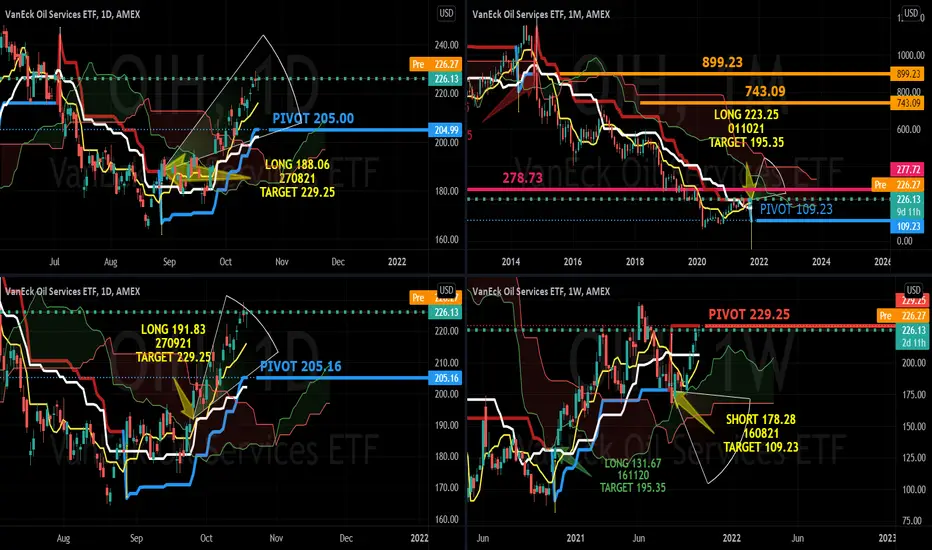
VanEck Oil Services (OIH) forms a baseOIH has been on a downtrend since the monthly short signal at $897.65 on 3rd Nov 2014. It broke its 2001 lows at $278.73 and formed a new low at $66 020320.
The monthly charts show a breakout of the downtrend in the month of October with a long signal issue on 011021 at $223.25. The weekly charts has maintained above the ichimoku cloud SSSA line despite the short signal on 160821 at $178.28. A break above the week pivot of $229.25 will START a new uptrend in the medium term. This is likely if the long signal on the day charts at $188.06 on 270821 breaks and stays above $229.25
Long Term BASEFORMING since 011021
Medium Term BASEFORMING since 161120
Short Term UPTREND since 270821
PIVOT 229.25
Short positions below 229.25 for 205 and 109.23
Long positions above 229.23 for 743.09 and 899.23
Oil ETF, $OIH with a "head & shoulders" patternA lot of analyst have been publishing bullish outlooks for AMEX:XLE . But we have AMEX:OIH in our portfolio for long term position and now is also making several bullish signs. Bullish divergence with the MACD, above average buying volume and price action making a head & shoulders pattern (reversal pattern).
This trade would be a short term trade. The buy point is on the breakout above $197 and the target for profit taking is at $230 for a 16% profit. The projection for price target comes from the rules of the "h&s" pattern. According to the Bulkowski Chart Pattern Ranking (thepatternsite.com), this pattern is Rank #1 with a 50% chances of a throwback after the breakout, so be aware.

OIH Descending Channel on the Monthly?Appears to be a descending channel happening on the Monthly TF. Is the reversal happening? I believe so with the resurgence play still intact this thing is a ticking time bomb. Oh and airspace on the MACD this setup appears extremely bullish. I'm a buyer here on leaps and common stock and plan on holding for the next 5-10 years I will retire at 35.

Bullish Trend in OIH still intact?Fundamentals within OIH ETF still look very good coming up on earnings, and the Bullish trend still looks in play. Expecting a bounce very soon and a possible double or triple for OIH long term. Check the history on whenever OIH has been this oversold. Could be biased, but I am bullish. Life of a contrarian #Bullish


go long OIHAfter almost 7 years of bearish price action, oil services will be essential in the transition to electric vehicles and clean energy. Most automakers are shooting for 2025 to have an entire EV fleet or mostly EV fleet. That's a 4-7 year runway for a bull run; assuming that it will take time to transition and for all automakers to be on the same page. Freight and travel will only increase with time further improving demand for oil and oil services.
Tom Lee from Fundstrat gave this oil services ETF a price target of $740 if oil hits $80 a barrel which seems extremely likely with the macroenvironment. Playing this trend through an ETF is the safest way to play it because you are taking out the idiosyncratic risk of being tied solely to a single company.
The top ten holdings of OIH are:
SLB: 22.46%
HAL: 13.21%
BKR: 5.84%
FTI: 5.22%
CHX: 4.97%
TS: 4.63%
LBRT: 4.57%
NOV: 4.37%
HP: 4.13%
RIG: 4.00%
Weekly Chart:
Daily Chart with Golden Cross:

Cup and Handle on OIH Looks like a pretty good set up, especially with oil having a very high demand.

$OIH Triggers New MA Bull SignalOIH is the Oil Eq and Services ETF. Just triggered another 50-day MA bull signal this morning. Last time was in January and set off a 75 pt run.


$OIH Breaks Out as Oil Assumes Leadership RoleOIH is the oil services ETF. Oil plays have been breaking out in a big way as the sector takes over a leadership role. But these stocks are still way below their 52 week highs, unlike most of the market. As oil ramps higher, we will have to start investing in oil production or risk a scary squeeze in oil. OIH holdings are the beneficiaries of this worry.


Iron TariHi guys,
according to my strategy we have 4weeks 15% strikes, 93% probability of success.
For this Iron condor with 5$ spread for each side there is a max profit of 100$ and a max loss 400$: if you are new in Iron condor you should find this R/R ratio very poor compared with forex, but we have very high odds at our side! 93% to get the maxim profit, plus 5$ extra on both sides (the long legs) before to get tha max loss. If the weekly candle closes over the short strike we close the trade, for a loss lower than max loss of 400$.
I prefer a strangle this time, max profi is 250$, and if things go wrong I close the trade for a max loss of 800$, getting a better R/R ratio, always with a 90% of max profit!
Enjoy your wallet!
Tari.

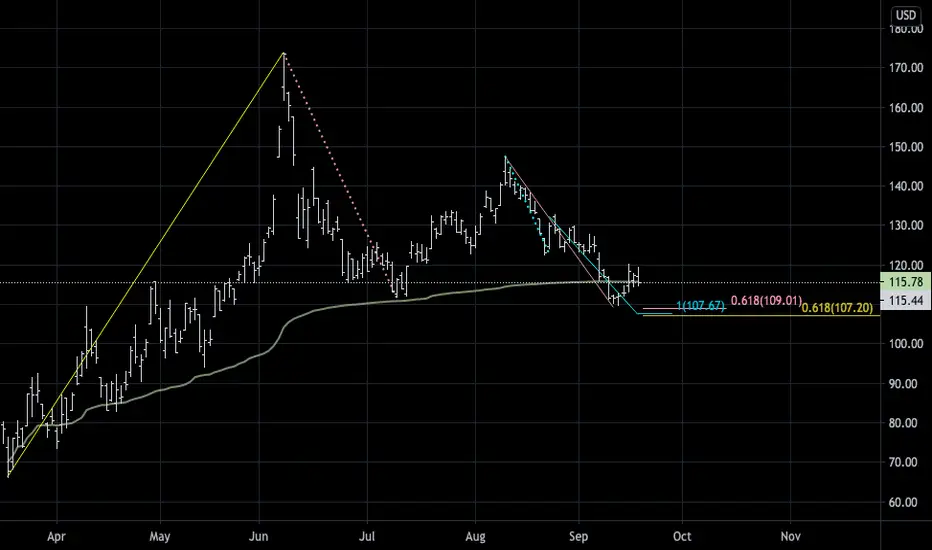
OIH reversing higher from 109-107.2 area3 Fibonacci price relationships in the 109-107.2 area
.618 extension red dot swing low
1.0 extension of blue dot swing low
.618 retracement of move from March low
VWAP from March low has acted as support throughout the move higher
ShortMarket wants to drop but as u see PPT holding it
I am shrt QQQ LONG UVXY GDX SMALL LONG SPY
Enjoy video


$spy $usoil $oih $xle $xop Somethings gotta giveThis downward valuation of e&p oil stocks, vs actual oil, has reached stupendous levels. Something has got to give. What and when will a catalyst appear to correct this?

