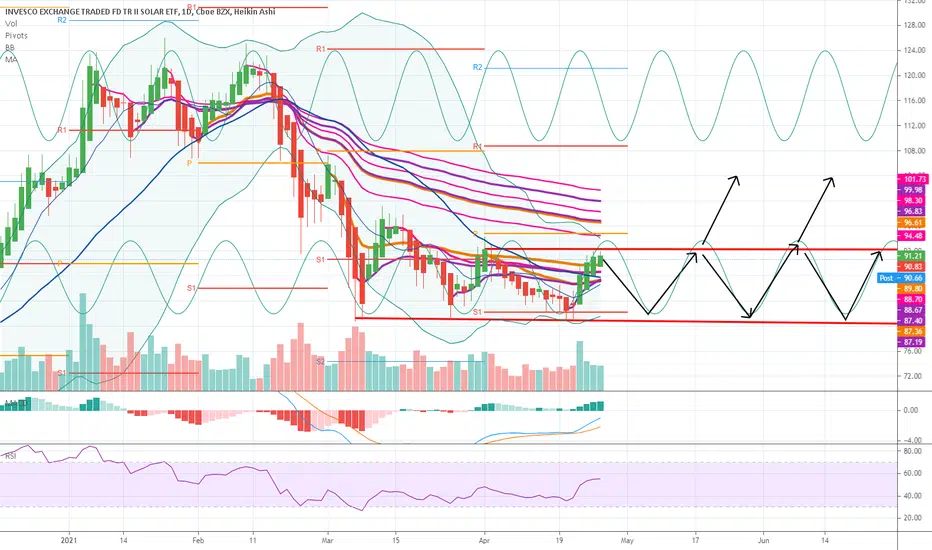
Symmetrical Triangle - Watching closelyVery similar formation on TAN and the ICLN as expected, personally am bullish long-term. Closed on Friday sitting right on its 200-day EMA which it has previously bounced off of as well as approaching the end of a big symmetrical triangle. Undoubtedly a long-term play, but will be keeping a close eye on this one. Just some support and resistance levels and some RSI based supply and demand zones to keep an eye on as well- bullish
TAN trade ideas

Closing (IRA): TAN September 17th 70 Short Put... for a .38 debit/contract.
Comments: Plain Jane profit-taking here in advance of vacation. In for 1.15 (See Post Below), out for .38 here. .77 ($77) profit/contract.

Closing (IRA): TAN August 20th 75 Short Put... for a .22/contract debit.
Comments: Collected a 1.32/contract in credit for these. (See Post Below). Taking profit here: 1.32 - .22 = 1.10 ($110) profit per contract. Still have September 17th 70s on.

Opening (IRA): TAN September 17th 70 Short Put... for a 1.15/contract credit.
Notes: With 30-day implied at 42.8%, it's toward the top of my exchange-traded fund implied volatility screener. (The others are TQQQ, ARKK, MJ, XLE, and ARKG). Selling out in September here, as I've already got a rung on in August at the 75 strike. 1.7% ROC at max as a function of notional risk.

🌻 SOLAR ENERGY - About to BOOM! 🌞Some posts I like to go back to and say 'Hey, I bought at a great time, i did well'
I have a feeling this will be exactly in this category in a years time. Same as it happened with Lithium for example
Looking at this chart I have a statement to make: It WILL rise and it WILL make me money. That's my opinion after i have also done research:
🌄 Fact 1 : US is about to invest heavily and compete with China
🌄 Fact 2 : There is a Global urgency to limit emissions
🌄 Fact 3 : Biden's plan is clearly to Boost this industry NOW!
🌄 &utm_content= &twclid=11414976558985617409]Fact 4 : Some of the major disadvantages have been improved. (Cost and efficiency)
🌄 Fact 5 : The Sahara can be Europe's next big investment
🌄 Fact 6: Our civilization depends on it's ability to use the Sun's energy!!!! (Google Kardashev scale )
🌅Advantages:
🔆Solar power is pollution free and causes no greenhouse gases to be emitted after installation
🔆Reduced dependence on foreign oil and fossil fuels
🔆Renewable clean power that is available every day of the year, even cloudy days produce some power
🔆Return on investment unlike paying for utility bills
🔆Virtually no maintenance as solar panels last over 30 years
🔆Creates jobs by employing solar panel manufacturers, solar installers, etc. and in turn helps the economy
🔆Excess power can be sold back to the power company if grid intertied
🔆Ability to live grid free if all power generated provides enough for the home / building
🔆Can be installed virtually anywhere; in a field to on a building
🔆Use batteries to store extra power for use at night
🔆Solar can be used to heat water, power homes and building, even power cars
🔆Safer than traditional electric current
🔆Efficiency is always improving so the same size solar that is available today will become more efficient tomorrow
🔆Aesthetics are improving making the solar more versatile compared to older models; i.e. printing, flexible, solar shingles, etc.
🔆Federal grants, tax incentives, and rebate programs are available to help with initial costs
🔆No trenching is needed since the solar can be close to or at the place of installation
To the moon? Well as a Greek. I do prefer the Sun ( Helios )
One Love,
the FXPROFESSOR 🌞🌻


TANTAN could possibly pullback and form a cup and handle formation. Keeping my eyes on the energy sector.

Opening (IRA): TAN August 20th 75 Short Put... for a 1.32/contract credit.
Comments: One of the exchange-traded funds that still has a 30-day implied of greater than 35% here (it's 38.8% at the moment) with expiry-specific at 40.3%. Unfortunately, it doesn't line up fantastically with price action; the strike is above the previous swing low around 68. However, I'm fine with taking assignment if that happens and proceeding to sell call against.


ABC Bullish Symmetrical TrianglePossible stop below C but I see support not too far under price at a gap that is now filled. Unfilled gap overhead that could cause resistance.
There is little or no price action in a gap and gaps can serve as support and resistance levels, but not always. IE..if a good news or an earnings beat occur it can send a security right through a gap above, and bad news can cause a security to shoot down through a gap below, blowing that support. Once the gap begins filling, it will rarely stop until the gap is filled as there is no price action inside of the gap to hinder the movement of price.
Breakaway gaps can signal the beginning of a new trend and sometimes these gaps do not fill for a long time
Exhaustion gaps occur near the end of a price pattern and signal a final attempt to hit new highs or lows. These usually fill in a short amount of time and is a good time for most to exit gracefully (o:.
Continuation gaps, also known as runaway gaps, occur in the middle of a price pattern and signal a rush of buyers or sellers who share a common belief in the underlying stock's future direction.
Even though this is an ETF, it can be volatile. I chose the long entry level based on the possible resistance of the gap, but you may find an entry level that works for you. The closer to support you can get, the better of course. For me, entry level is very important because it can mean a lot to my psyche to not see red on a daily basis. Patience can pay off big time when it comes to a long entry level. Selling at the right time is another thing I am working on.
No recommendation

Invesco Solar UpThis is pure systematic view on the TAN , I see a probable upmove from now it could give larger targets therefore I'll update for the trade management

TAN - possible breakout of local consolidationEntry price 80.00
Stop loss 76.00
Solar stocks were the first ones had showed relative strength and bounced of the bottom. Very constructive setup, risk 5%.

$TAN $SOL etc long term come back?Hello,
The solar sector as seen by $TAN appears to be ready to stage a come back. Money has started to flow into the sector as seen on the CMF and is displaying bullish behavior. On book volume has crossed the average and appears to be showing accumulation of solar stocks. Momentum is returning to this sector. Over the summer months Jun-August we will probably see a solar come back. My favorites for this are
$JKS $TAN $SOL and $FSLR
Best of luck. As always, I am not responsible for your trades. Control your risk. I am not responsible for your profit or loss. I only provide ideas.

Solar Energy ETF - Death CrossChart shows death-cross highlighted as a pink circle. The definition of a death-cross is when the 50sma crosses below the 200sma.
This technical pattern signals further downside.
The red horizontal level R1, is the bullish short-term target, if we can cross the 50 (orange) and 200 (red) moving averages, and revert the death-cross. However, unless we can stay above the mid-level (blue-line), that is unlikely happening..
S1 could be an important support around $58, as we see a couple of tests back in September 2020.
OBV shows lower lows, supporting the downtrend.


TAN Wolfe Wave Playing OutNew to the Wolfe wave but this looks like a textbook setup to me. Follows up on my previous weekly chart. of TAN for the breakout as well.

Bullish on clean energy. 24-04-2021
Support @ $80
Bias on bullish.
Biden’s Plan To Create Over 10 Million Well-Paying Jobs With His Clean Energy Initiative

Solar Energy descending-triangle BreakoutSolar energy ETF is currently breaking out of a descending triangle.
There are multiple resistance levels to take into account. However, a measured move from the current break of the triangle, is taking us to $113 approximately, which is my mid-term target.
MACD has been uptrending while the price has been downtrending, the divergence is bullish signal for this breakout to hold.
The MACD histogram has also been positive for the divergence period.
Volume still needs to improve.

Closing (IRA): TAN May 21st 70 Short Put... for a .23/contract debit.
Notes: In for 1.93/contract (See Post Below), out for .23; 1.70 ($170) profit per contract. Options have gone somewhat illiquid versus when I put this on, so am fine with not waiting another 28 days for the small remainder of extrinsic to piss out.

$TAN Bat Pattern @HIDDEN HARMONICS TRADING GROUPSee chart for Bat pattern on $TAN looks a lot like my $FSLY bat that did well this week
