BNX is not for shorting!!!YET..Hi everyone,
BNX made a massive pump of almost 35%..
The coin is still on a uptrend!
Open a short position right now would be harmfull for your portofolio..
Of course is depends of what percentage you are after..
Trade safe!
BNXUSDT trade ideas

BNX - Finding Support, Resistance and Trade SetupsAfter yesterday's push to test the $1 level, BNX got hit with some rejections. Following the swing high SFP (Swing Failure Pattern), the price is down about 10%. Let's update our analysis with some key levels that clearly outline our support and resistance zones, and then we'll dive into the trade setups.
Support & Resistance Criteria
Resistance Levels
BNX faced rejection around the $1 mark, with the resistance zone clearly defined between $1.0137 and $1.0263
A short trade could have been initiated from this zone, with a stop loss placed just above $1.03
The Fibonacci retracement highlights key resistance levels at: 0.618 retracement at ~$0.9774, 0.786 retracement at ~$0.9952
The Point of Control (POC) of the current trading range sits around 0.786, and the daily open is at $0.9966
The pitchfork upper resistance trend line further reinforces this area
Moving Averages Adding Resistance:
15-minute 200 SMA: Currently at $0.9836, aligning with the fib retracement 0.618 and adding extra resistance
1-hour 55 SMA: Currently at $0.98085, further supporting the resistance
Note: These SMAs are expected to move down in price over time
Support Levels
Primary Support for Long Trade Opportunity:
The overall short trade target remains at around $0.8, supported by multiple Fibonacci confluences:
-0.6 negative Fibonacci retracement at $0.7912
Trend-based Fibonacci extension 1.272 at $0.7914
The previous key high at $0.7801 and Fibonacci extension 0.133 at $0.7924
These levels give us a strong support window between $0.8 and $0.78.
If the price reaches this level by 17th February, the pitchfork's lower support trendline adds even more strength.
Moving Average for Support:
Daily 200 SMA: Currently at $0.7786, which confirms the support zone
Note: This SMA is expected to move up as time passes, reinforcing support over time
Additional Support Zone:
Another key support region lies between $0.72 and $0.7075, with a key level at $0.7177 supported by a weekly bullish order block, trend-based Fibonacci extension 1.618 at $0.7075, and the anchored VWAP (yellow line) just below.
Trade Setups
Short Trade Setup
Entry Strategy: Look for short entries between $0.981 and $1 as the price tests the resistance area. Confirm entry through order flow and rejection candles
Stop Loss (SL): Place the SL just above the recent high at around $1.018
Target: Aim to reach $0.8, where our confluence of Fibonacci levels and moving averages align
Risk/Reward Ratio: This setup offers an amazing risk/reward ratio of approximately 5:1! Potentially up to 9:1 with effective DCA (dollar-cost averaging) into the short trade
Long Trade Setup
Entry Strategy: If price drops decisively and reaches the support window between $0.8 and $0.78, consider a long trade on confirmation
Stop Loss (SL): Place the SL below $0.77
Target: Aim for a profit target at $0.85
Risk/Reward Ratio: This setup offers an approximate risk/reward ratio of 2.5:1
Keep an eye on the charts, set your alarms to the key support and resistance zones, and wait for a solid signal before jumping in. Be ready to tweak your strategy as the market shifts. Happy trading!

BNX Update: Where Is BNX Heading Next?UPDATE:
Price didn’t quite reach the 0.618 fib retracement level we initially eyed for a short entry, it got very close and then faced rejection off the pitchfork upper resistance trend line. This rejection triggered a sharp 13% drop down to a low of $0.8278. After a brief bounce, I'm still waiting for price to drop further toward the support zone at $0.8–$0.78. So far, the trade is unfolding as planned.
In addition, price has lost the VAL and daily support level, both now acting as resistance. The daily support sits at $0.8939, with VAL just below at $0.8846. This zone has already been tested and rejected, making it a great shorting opportunity.
Looking ahead, if bulls manage to push the price up to around $0.91, testing the previous low that broke and aligns with the 0.618 fib retracement of that drop, we’d have an ideal low-risk, high-reward short opportunity.
Short Trade Ladder Strategy:
Entry Range: Create a laddered short entry from the VAL at $0.8846 up to the 0.618 fib retracement at $0.9126
Stop Loss (SL): Place SL above the daily Open
Target: Aim for a target in the support zone at $0.8–$0.78
Risk/Reward Ratio: This setup offers a risk/reward ratio of around 3:1
Stay tuned for confirmation signals as the price approaches these levels, and be ready to adjust if the market dynamics shift. Till next time! Happy trading and stay sharp =)

Bearish opportunity in BNXPrice has reached the 75% premium level - I expect a pullback at these levels
We have a purge on buyside
We have CISD confirming order-flow
We have draws as the FVG around 1.055
Price is around the Daily order-block high
ALTERNATIVE SCENARIO: If this FVG at 75% Daily Chart fails, I expect price to continue higher up to 1.39 to 1.4 levels

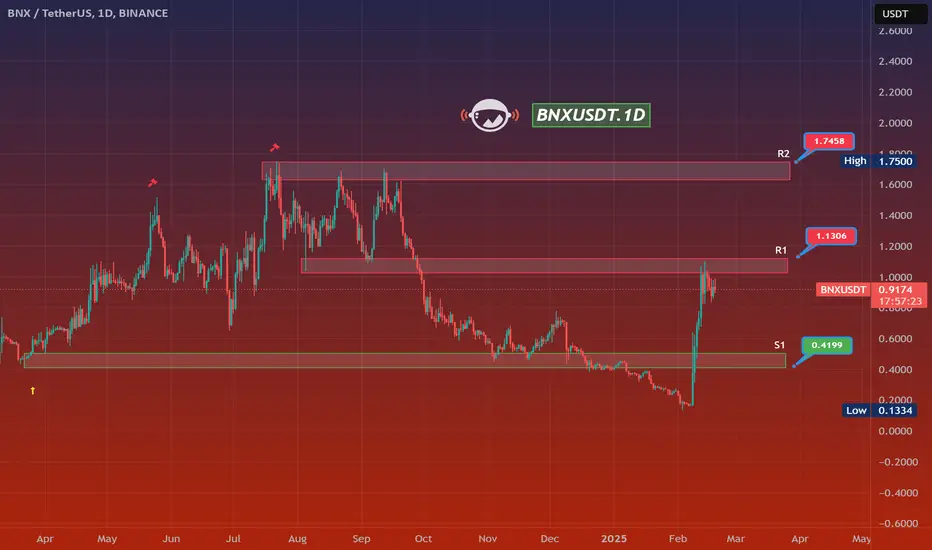
BNXUSDT.1DMarket Structure & Key Levels:
Current Price & Trend:
BNX is trading at $0.9169, showing a -1.80% decline, suggesting profit-taking after a sharp rally.
The recent price surge has led to a test of R1, a key resistance zone that has previously acted as a supply area.
Key Support & Resistance Levels:
S1 ($0.4199): A major support zone, where BNX previously bounced strongly.
R1 ($1.1306): A critical resistance level, which, if broken, could confirm a trend reversal.
R2 ($1.7458): A long-term resistance zone, which aligns with previous supply levels.
High: $1.7500 (last significant peak).
Low: $0.1334 (historical bottom).
Technical Indicators & Market Sentiment:
🔹 Trendline & Breakout Analysis:
BNX has recently rebounded from S1, signaling strong buyer interest in this range.
Breaking above R1 would confirm bullish continuation, while failure to do so may result in a correction.
🔹 Potential Bullish Breakout Scenario:
If BNX closes above $1.13 (R1), it may trigger further upside toward $1.50-$1.75.
A sustained move above R2 ($1.75) could lead to an extended rally toward $2.00-$2.50.
🔹 Bearish Pullback Scenario:
If BNX fails to break R1, price may retrace toward $0.75-$0.65, before attempting another move higher.
A breakdown below $0.60-$0.50 could result in a retest of S1 ($0.42).
🔹 Liquidity & Volume Analysis:
Volume remains high, suggesting strong interest in the asset.
However, profit-taking near resistance zones could cause short-term pullbacks.
🔹 Market Psychology:
$1.13 is a key psychological level, where buyers need to step in to confirm trend continuation.
If BNX closes above R1, a bullish sentiment shift could accelerate the rally.
Conclusion & Trading Strategy:
Given the current price structure, my trading plan involves two key scenarios:
1️⃣ Bullish Breakout Strategy:
If BNX closes above $1.13 with strong volume, I will enter a long position, targeting $1.50-$1.75.
A move beyond $1.75 would open doors for $2.00-$2.50 in the mid-term.
2️⃣ Bearish Retest & Pullback:
If BNX fails at R1, I will wait for a dip toward $0.75-$0.65, before considering long re-entry.
A break below $0.60 would indicate further downside risk, potentially leading to a retest of $0.42-$0.40.
Risk Management:
Stop-loss for longs: Below $0.85 to protect against fake breakouts.
Stop-loss for shorts: Above $1.20 in case of a bullish breakout.
Leverage approach: Conservative, due to high volatility in BNX’s price swings.
Final Thought:
BNX has staged an impressive recovery, but it now faces major resistance at $1.13. The next 24-48 hours will be crucial, as a breakout could fuel bullish continuation, while rejection may lead to a deeper pullback. I will closely monitor volume and price action confirmation to determine the best entry points.
BNX Breakdown: The Next Trade SetupBNX has recently been testing a key resistance zone around the $1 level. After hitting the 0.618 Fibonacci retracement at $1.10, the market shifted into a downtrend. Let's analyse where our next trade opportunity might arise.
Market Structure & Confluence Zones
$1 to $1.1: BNX encountered robust resistance between $1 and $1.1, where the 0.618 Fib retracement aligns perfectly with the fib speed fan (0.618-0.65). Additionally, the anchored VWAP taken from the high at $1.1 aligns beautifully with the $1 mark, adding another robust layer of resistance. This convergence reinforces the strength of this zone and signals potential continuation of the downtrend.
Recent price action shows that BNX has repeatedly bounced off the 0.618/0.666 levels during small downward corrections.
Moving Averages on the 1-Hour Chart: The 21 EMA/SMA on the 1-hour timeframe is clustering between $0.97 and $1, providing additional confirmation of the resistance and offering an ideal entry region for short trades.
Primary Short Trade Setup
Given the multiple confluences around the resistance zone, our main focus is a short trade with a well-defined laddering strategy:
Entry Strategy (Laddering): Initiate short positions with staggered entries between $0.97 and $1.019. This dollar-cost averaging (DCA) approach allows for flexibility and optimises your entry as price tests the resistance zone.
Stop Loss (SL): Place your stop loss around $1.0375, just above the Point of Control (POC) or the previous high in this range to effectively manage risk.
Target: Aim for a profit target at $0.8. This target is supported by multiple technical indicators.
Risk/Reward Ratio: With these levels, you are looking at an approximate risk/reward ratio of 4:1 or better, depending on your specific DCA weighting.
Confirmation: As always, await confirmation through order flow analysis and the appearance of rejection candles at key levels before entering the trade.

BNX Soars to New Heights: A Strong Uptrend Signals Promising FutHi everyone!
BNX is on uptrend and is the perfect moment to buy with price target 1.23.
Shorting this coin would be a massive mistake as smarts money plan is to sweep the shorts!!
Chart looks bearish but don't fall in to their trap!
If you open a long position make sure you are covered for at least 25% drop. Avoid the high leverage! Remember profit is greater that loss.
We are not day traders. just profitable traders!
Our job is to identify the trend.
Trade safe

BNXUSDTmy entry on this trade idea is taken from a point of interest below an inducement (X).. I extended my stoploss area to cover for the whole swing as price can target the liquidity there before going as I anticipate.. just a trade idea, not financial advise
Entry; $0.9223
Take Profit; $1.2246
Stop Loss; $0.8260

Riding the BNX Wave: Next Trade SetupsSince BNX surged an astounding +381% in just 3.5 days, it has rapidly reached a key high. However, the dramatic move on low volume has left the market in a tight range, raising questions about a potential correction. Let’s break down the current market structure and explore the key support and resistance levels, followed by specific trade setups.
Looking Back: Market Structure & Trends
BNX’s meteoric rise over a short period has captured attention, but such rapid gains often invite consolidation or a pullback. After hitting the key high, the price was tested and subsequently rejected, particularly on low volume. This rejection signals that the bullish drive may be exhausting, setting the stage for a possible downward correction. Since then, BNX has been trading in a narrow range, reflecting market indecision as traders await further direction.
Key Support Zones & Confluences
Primary Support Zone – Around $0.6:
Moving Averages Confluence: The 21-period EMA and SMA on the 4-hour, weekly, and monthly charts are clustered between approximately $0.585 and $0.553. This convergence creates a robust support area where price is likely to find stability.
Lower Timeframe Trend Insight: My beta indicator on the 15-minute chart, which marks the edge of the bullish trend, further reinforces this support level.
Fibonacci Confluence:
The 0.382 Fibonacci retracement sits at around $0.5426, lending additional support.
The Fibonacci Speed Fan (0.5 level) aligns near $0.56, complementing the overall support picture.
This confluence of technical factors makes the $0.6 zone a crucial area to monitor, as it represents a potential floor should the market trend lower.
Resistance Levels & Confluences
Key Resistance – The Recent High:
Rapid Price Surge & Rejection: BNX’s swift ascent culminated in a key high that was subsequently tested and rejected. The rejection, especially on low volume, indicates that the upward momentum may be losing steam.
Fibonacci Resistance: Notably, the price has also encountered the 0.382 Fibonacci retracement at $0.75, which acts as an additional layer of resistance.
Psychological Resistance: The key high now serves as a significant resistance level, acting as a barrier that the price must overcome to resume its bullish trend.
Potential Trade Setups
Short Trade Setup
Given the rejection at the key high and the low-volume consolidation, a breakdown from this level is anticipated. This scenario makes a short position attractive, as a failed test of the high could trigger further downward movement.
Entry & Stop Loss (SL):
Entry: Initiate a short position at the key high, followed by a rejection.
Stop Loss: Place your stop loss just above the key high to mitigate risk.
Target & Risk/Reward:
Target: Aim for the primary support zone around $0.6, where multiple indicators converge.
Risk-Reward Ratio: The setup targets a favourable risk/reward ratio of 3:1 or better, making it an appealing opportunity for traders.
Long Trade Setup
Despite the clear support confluence around the $0.6 area, entering a long position at this stage carries a less compelling risk/reward profile compared to the short trade.
Entry & Stop Loss (SL):
Entry: Consider a long entry if the price shows strength and decisively holds above the support zone.
Stop Loss: Position the stop loss just below the support area to accommodate minor fluctuations.
Target & Risk/Reward:
Target: The target for a long setup would be the previous swing low.
Risk-Reward Ratio: This trade offers a ratio in the range of 1:1 to 2.5:1, which is alright compared to the short setup.

Still bearish on $BNX exhaustion move1. Price has closed the weekly FVG
2.We have structure shift in H1
3. We have price been bearish on H1
4. Price moved from 0.3 to 1 USD nonstop therefore we might expend an exhaustion move

bnx analysis: important support.hello friends
Due to the heavy fall of this token, it has now reached a good and important support, and by maintaining and stabilizing this support, we can move up to the specified goals or even higher with capital management.
*Trade safely with us*

BinaryX (BNX): HUGE CMECoin has been having some magnificent moves despite the overall market conditions we had.
Now every ride has come to an end sometime so we are expecting to see a bigger drop or a correction to come here so stay sharp and wait for proper signs here. If we keep the current momentum of weakness, we might see good movement to lower zones!
Swallow Team

BNXUSDT Double Bottom Pattern s Potential 100%-150% GainBNXUSDT has recently shown signs of a promising bullish reversal pattern known as the Double Bottom Pattern, which has garnered significant investor interest. The Double Bottom is a well-known chart pattern that signals a potential reversal of a downtrend, and its presence suggests that the price could soon make a sharp move upward. With strong volume behind this pattern, it indicates that the market sentiment is shifting positively, with more traders entering the market. This could lead to a significant price rally in the coming days or weeks, with potential gains ranging from 100% to 150% or more.
Investors are closely watching BNXUSDT, as this coin has caught attention due to its solid technical setup. The good volume accompanying the pattern is a key signal of confidence in the market, and it increases the likelihood of this breakout becoming a reality. As the market sentiment grows more bullish, traders may see this as a perfect entry point for capturing substantial gains. The combination of solid technicals and growing investor interest positions BNXUSDT as one of the most talked-about crypto pairs for the near future.
Additionally, this pattern reflects a strong level of support that BNXUSDT has established, further validating the potential for a reversal. If the price manages to break above the resistance level, it could trigger a new bullish trend that sees the price move higher. The increase in volume suggests that buyers are ready to take control, and this trend could continue, especially if the broader crypto market shows positive movement. Investors who enter at the right time could benefit from explosive returns as the price looks to retest its previous highs.
As always, it’s important to monitor the broader market conditions, including the performance of Bitcoin and other major altcoins, as they can impact the movements of BNXUSDT. Traders should also keep an eye on key support and resistance levels to make informed decisions. Overall, BNXUSDT presents a compelling opportunity for traders looking for high-reward setups, and with a solid Double Bottom Pattern in play, it could be primed for a major breakout in the near future.

BNX SHORT H3Crypto Introduction
BNX is the governance token of BinaryX. BNX holders can participate in community governance and vote on major decisions. Some key operations of the game require consuming BNX tokens, such as creating heroes, forging rare equipment and challenging the Cyber Dragon dungeons.

End of the FVG zone - Rising Wedge - Divergence - Elliot point 5Hi Traders,
This element has ran a very nice rally.
The technical signes show us a correction is next soon!
Good luck!

#BNXUSDT further bullish movement📈 LONG BYBIT:BNXUSDT.P from $0.6836
🛡 Stop Loss: $0.6436
⏱ 1H Timeframe
✅ Overview:
➡️ BYBIT:BNXUSDT.P broke through a key resistance at $0.6791, confirming buyer strength and signaling further bullish continuation.
➡️ Volume is increasing, indicating strong market interest in the uptrend.
➡️ POC at $0.4528 suggests that major liquidity was accumulated significantly lower, reinforcing the bullish trend.
➡️ The next upside target is $0.7396 , followed by $0.7873 if momentum continues.
⚡ Plan:
📈 Bullish Scenario:
➡️ Enter LONG from $0.6836 if the price maintains support above this level.
➡️ Manage risk with Stop-Loss at $0.6436 to protect against downside moves.
🎯 TP Targets:
💎 TP1: $0.7396 — first resistance level, potential profit-taking zone.
🔥 TP2: $0.7873 — strong level where buyers may exit.
🚀 BYBIT:BNXUSDT.P Expecting further bullish movement!
📢 If the price BYBIT:BNXUSDT.P holds above $0.6836, further upside toward $0.7396 and $0.7873 is likely.
📢 However, if it drops below $0.6436, the bullish setup may be invalidated.

BNX: After a +900% Rally, What's Next?BNX had an incredible run, skyrocketing +900% in just 19 days, completing a 5-wave Elliott Wave structure and peaking at $1.3333. Since then, the price has been in a downtrend, now approaching the critical $1.00 psychological support level.
Key Support Levels
The weekly open sits at $0.9387, aligning perfectly with the Point of Control (POC) from the previous trading range, making this a crucial level to watch. However, the bigger question remains—where is the next high-probability trade setup?
Liquidity Below $0.8278 – There's a significant liquidity pool just below this low, making it an attractive area for potential stop hunts before a reversal.
0.5 Fibonacci Retracement ($0.7333) – Measuring the full +900% move, the 50% retracement aligns near a key support zone.
Weekly Bullish Order Block ($0.7076) – A historical area of demand, adding further confluence.
1.272 Fibonacci Extension ($0.7250) – Another confirmation of a potential bounce area.
Anchored VWAP from $0.1334 – Currently sitting at $0.6675, this dynamic support strengthens the buy zone.
0.618 Fibonacci Speed Fan – If the price drops towards this level by late February, it could provide additional confluence for a bounce.
Potential Trade Setups
Bullish Setup: If price sweeps $0.8278 liquidity and enters the $0.7333 - $0.7076 demand zone, a long opportunity with confirmation could offer a great risk-to-reward trade.

Bearish on $BNX1. We have structure shift on H1
2. Price has purged Weekly OB+ Buyside liq (buystops)
3. We have sellside to purge at the 50% range of the main dealing range, we also have a discount fvg we might fill
4. Price has returned to entry FVG

HODLE BASKEThello friends
This coin gave a buy signal and we informed you.
After hitting the bottom of the channel, it showed a good reaction, which is a good position to buy.
We have specified the entry steps for you and don't forget capital management.
Be successful and profitable.

Will BNX continue the uptrend or will dump it??Hi everyone,
BNX will continue the uptrend and lot's of short positions have been opened!Hope you are not one of them!
With price target of 1.20 we feel very confident that it will reach it in the upcoming weeks (if not this one).
Feel free to add a stop loss on 0.64.
Avoid the high leverage and stay hamble as profit is greater than loss!
Our job is to identify the trend and not day trading!
Stay tuned for more

BNX LONG !!!#BNX/USDT
Entry zone : 0.921403 - 0.948950
Targets : 0.954602 - 0.973505 - 0.992408 - 1.011311 - 1.030214 - 1.049117 - 1.068020 - 1.086923
Stop loss :0.883407

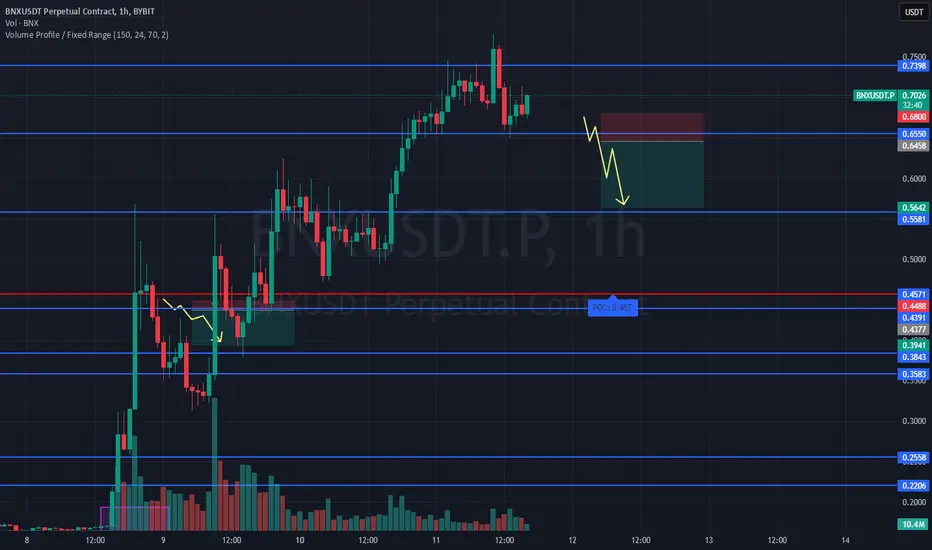
#BNXUSDT is weakening expecting a drop📉 SHORT BYBIT:BNXUSDT.P from $0.6458
🛡 Stop Loss: $0.6800
⏱ 1H Timeframe
✅ Overview:
➡️ BYBIT:BNXUSDT.P is near resistance at $0.6853, showing signs of weakness.
➡️ A pullback is expected after failing to hold above $0.6550.
➡️ Targeting support levels at $0.6060 → $0.5642.
⚡ Plan:
✅ Bearish scenario confirmation – price needs to break $0.6550 and stay below it. If confirmed, the short position remains valid.
✅ Critical resistance level – $0.6853. If the price moves above $0.6800, the trend may shift bullish, invalidating the setup.
✅ Volume analysis shows weakening buying interest, supporting the possibility of a correction.
✅ Profit-taking zones – $0.6060 → $0.5642. If price slows down around $0.6060, a bounce is possible, so partial profit-taking is recommended.
✅ Alternative scenario – if price bounces from $0.6060, a long position with a tight stop could be considered.
📍 Take Profit targets:
🎯 TP1: $0.6060 – testing the nearest support level.
💎 TP2: $0.5642 – deeper correction zone.
🚀 BYBIT:BNXUSDT.P is weakening — expecting a drop to $0.5642!
📢 A break below $0.6550 confirms the bearish scenario.
📢 Holding below this level strengthens the case for further decline.
📢 If price surges above $0.6800, the setup is invalidated.
BNX CHART ANALYSİS- EDUCATIONAL POSTWhy Track Insider Trading
Insider trading is one of the least known successful stock market anomalies. It’s managed to beat the market by an average of 7 percentage points annually over the past 50 years. Several peer-reviewed academic studies covering different time periods document the profitability of insider trading. It’s profitable in the United States and in several other developed countries. Perhaps most importantly, it was possible over the past half century to beat the market by imitating insiders’ purchases.
Top officers, members of the board of directors, and 5+% shareholders are classified as insiders. Consultants, lawyers, and underwriters become insiders for short periods of time when they possess market moving information about the companies with which they are affiliated. What makes a person an insider is their possessions of market moving information and fiduciary duty to the shareholders of the company. Possession of market moving information gives insiders an edge over other investors and helps them beat the market.
Insiders also have an edge over retail investors because they usually know their businesses and their industries inside and out. They know what products they’ll be launching, strategies they’ll be pursuing, and which businesses they’ll be acquiring or divesting. Such information is generally not disclosed to the public in detail. It is illegal for insiders to trade based on material non-public information but perhaps more importantly, it is nearly impossible for prosecutors to detect and prosecute such transactions.
It’s possible for insiders to profit legally from market moving information. When they’re in possession of imminent negative non-public information they can postpone their purchases until after the disclosure and avoid losses. The absence of insider buying may be a signal for negative news in some cases. Similarly, when insiders are in possession of imminent positive news they can postpone selling their holdings and indirectly profit from inside information. Drops in insider sales may be a signal for positive news in some cases.
