BOMEA meme that came out of thin air and has a ton of liquidity and a mysterious owner. The black horse among all memes. Explsoive pump incoming before end of may to 0.018.
BOMEUSDT.P trade ideas

BOOK OF MEME (BOME) a setup for upto 27% pumpHi dear friends, hope you are well and welcome to the new trade setup of BOOK OF MEME (BOME) with US Dollar pair.
Recently we caught almost 20% pump of BOME as below:
Now on a 4-hr time frame, BOME is completing the final leg of a bullish Gartley move for the next price reversal.
Note: Above idea is for educational purpose only. It is advised to diversify and strictly follow the stop loss, and don't get stuck with trade.

BOME/USDT | 1D 👀Could be considered for purchase.
After all the growth and correction with accumulation, a clear pattern is forming on the chart (daily timeframe), which I have noted.
I expect to see its completion within the next 2-3 weeks, so I bought the coin at market price with 1% of my deposit from the current levels.
- Not financial advice, trade with caution.
✅ Stay updated on market news and developments that may influence the price of BOME. Positive or negative news can significantly impact the cryptocurrency's value.
✅ Exercise patience and discipline when executing your trading plan. Avoid making impulsive decisions driven by emotions, and adhere to your strategy even during periods of market volatility.
✅ Remember that trading always involves risk, and there are no guarantees of profit. Conduct thorough research, analyze market conditions, and be prepared for various scenarios. Trade only with funds you can afford to lose and avoid excessive risk-taking.
#Crypto #BOME #Investment #BOOK_OF_MEME

BOME/ TetherUS_ Next _ Prices _ Under _ Binance _ Custody_ TradiBOME/ TetherUS_ Next _ Prices _ Under _ Binance _ Custody_ Trading _ Venue!
Clean Data not some type of messy data such as H.Barr or many other I have seen! Whoever is running the back data they have a good data management team! Simply I don't care what assets class I'm writing the key factors is the numbers are in good order!
Next Prices:
$0.013307
$0.013756
$0.013955
$0.014620
$0.015846
$0.016960
Distribution price: $0.016485, possibly will go as high as $0.017375!

#Bome Sailing the Crypto Seas: A Strong Buy Signal Beckons!**Technical Analysis Chart Description:**
Welcome to my Technical Analysis charts on TradingView! Before we dive into the analysis, it's essential to understand some important warnings:
1. **Subjectivity Alert:** Technical analysis involves interpreting market data and chart patterns, which can be subjective. Different analysts may interpret the same data differently, leading to varied conclusions.
2. **Historical Performance Doesn't Guarantee Future Results:** Past price movements do not guarantee future price movements. While historical data can provide insights, it's crucial to consider other factors that could influence price action.
3. **Risk of False Signals:** Technical indicators and chart patterns can produce false signals, leading to potential losses if relied upon blindly. Always cross-verify signals with other indicators or fundamental analysis.
4. **Market Volatility:** Crypto markets are highly volatile and can experience rapid price fluctuations. Be prepared for sudden and unexpected price movements, which may invalidate previously identified patterns.
5. **Risk Management:** Proper risk management is essential. Never invest more than you can afford to lose, and consider using stop-loss orders to mitigate potential losses.
6. **Emotional Bias:** Avoid emotional decision-making based on short-term price movements. Stick to your trading plan and strategy, and don't let fear or greed influence your decisions.
**Disclaimer for Crypto Trading:**
Trading cryptocurrencies carries inherent risks, and it's important to understand the following:
Cryptocurrency markets are highly speculative and can be subject to extreme volatility. Prices can fluctuate significantly within short periods, leading to substantial gains or losses.
Investing in cryptocurrencies involves the risk of total loss of capital. Unlike traditional assets, cryptocurrencies are not backed by any tangible assets or central authority, making them inherently risky.
Regulatory uncertainty and market manipulation are additional risks associated with cryptocurrency trading. Regulatory changes or negative news can have a significant impact on prices.
This analysis is for informational purposes only and should not be construed as financial advice. It's crucial to conduct thorough research and consult with a qualified financial advisor before making any investment decisions in the cryptocurrency markets.
By using this analysis, you acknowledge and accept the risks associated with cryptocurrency trading and agree to trade at your own discretion. The author of this analysis shall not be held responsible for any losses incurred as a result of using the information provided.

$BOME #BookOfMeme Trading IdeaBOME/USD (BookOfMeme) successfully went down at the first call. Now there is a probability of breaking this resistance zone and retesting that sweet Golden Zone at around $0.018080. I want to see a clear breakout.

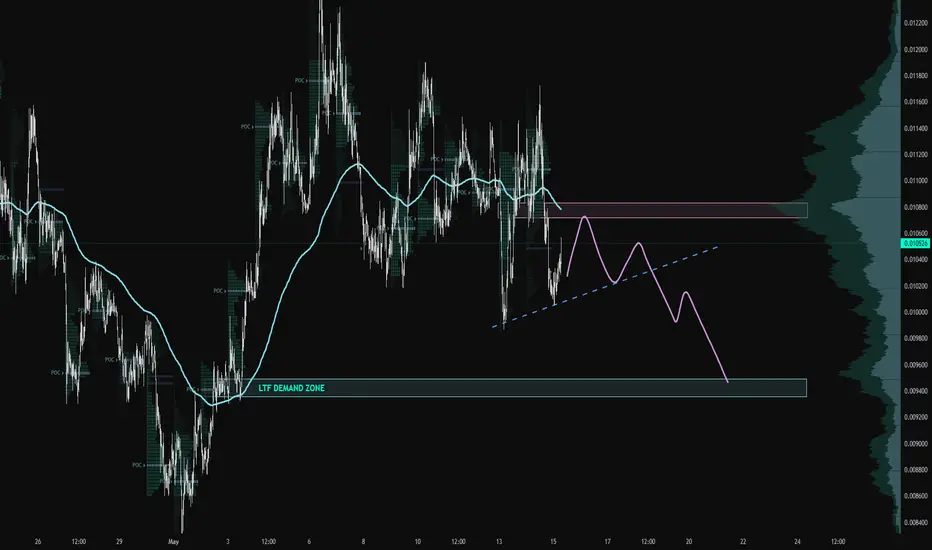
BOME ltf demand zonePrice is still looking bearish in lower timeframe
However, if Bitcoin can manage to hold 61.8k, BOME might retest .0107 to .0108 (high volume nodes)
Break .010 support, we can see it retesting .0095 to .0090 area (ltf demand)
Bomeusdt Trading ideaBomeusdt, recently added to Binance, presents challenges for comprehensive analysis due to limited data availability. However, we have observed price consolidating within a potential triangle pattern, which could result in either a bearish or bullish continuation.
Our bias leans towards an upside breakout scenario. Targets have been identified on the chart, with the immediate target corresponding to the upper boundary of the ascending triangle. In the event of a downward breakout, we anticipate a descent towards a robust demand zone, offering an opportunity for fresh accumulation of coins.
Caution is advised when trading Bomeusdt, given its recent listing and limited data. It is essential to closely monitor the provided stop-loss level to manage risk effectively.
Do share your perspectives and insights on Bomeusdt with us.

BOME Awaits Major Volume Influx and BOOM 💥This scenario represents a pivotal moment for BOME, suggesting that once the market liquidity significantly increases, it could trigger rapid price movements. Investors and traders alike are positioning themselves, ready to capitalize on the anticipated volatility, which could redefine BOME's market standing and deliver substantial gains to those who timed their entry well.

BOMEUSD 1WBOME ~ 1D
#BOME The sleeping green gem will wake up again after successfully breaking through the resistance line of this pattern.
Buy after breaking through this resistance line, with a minimum target of 20%+

#BOME chart looks interesting☝️ We are testing the resistance #BOME chart looks interesting☝️
We are testing the resistance confluence of Descending Resistance + Supply Zone👀
It's likely we had month of accumulation and now ready to play out✈️
Low risk though!
🎯1 Target - 0.016830$
🎯2 Target - 0.025750$


BOME analysis (4H)BOME has a strong resistance range ahead.
It appears to be forming a triangle or a more complex pattern.
When you reach the supply range, you can look for buy/long positions.
Demand range can be a good place to save profit.
Closing a daily candle above the invalidation level will violate the analysis
For risk management, please don't forget stop loss and capital management
Comment if you have any questions
Thank You

BOME USDT INR bull flag is a bullish chart pattern, i am expecting a bullish moment target 0.015$ within a week and INR target 1.1
bullish flag pattern success rate of 87.13%

BOME USDT BULLISH TARGET 0.02$BOME USDT "Unlock the potential for success with the retest zone. A breakthrough is imminent, and when it happens, it will be unstoppable. Keep faith and stay the course
. Remember - if it breaks up, it goes." goes."0.02$
IF DOWN 0.009

BOOK OF MEME (BOME) completed a setup for upto 15.50% pumpHi dear friends, hope you are well and welcome to the new trade setup of BOOK OF MEME (BOME) with US Dollar pair.
Recently we caught almost 20% pump of BOME as below:
Now on a 2-hr time frame, BOME has formed a bullish Gartley move for the next price reversal.
Note: Above idea is for educational purpose only. It is advised to diversify and strictly follow the stop loss, and don't get stuck with trade.

BOMEUSDT.PHello Trader BYBIT:BOMEUSDT.P
double bottom swing chart 4 hours to 1 day.
The buying area limit can be set in the range 0.11478 - 0.11321
It is not recommended to use full leverage because it is far enough for the stop loss to be around 5% from the 2nd entry area
Note: can be used as a spot chart, please install it
take profit 32%
stop loss 5%
Please add a comment and Positive feedback and constructive criticism are important to authors and the community.
Disclamer: Not Financial Advice

BOME / BOMEUSDTGood Luck >>
• Warning •
Any deal I share does not mean that I am forcing you to enter into it, you enter in with your full risk, because I'll not gain any profits with you in the end.
The risk management of the position must comply with the stop loss.
(I am not sharing financial or investment advice, you should do your own research for your money.)

Bome vs Usd medium term buy & Sell SetupBome vs Usd medium term buy & Sell Setup
Zig zag Buy Sell Target 0.0148

BOME/USDTHi everyone!
BOME is was moving in a falling wedge pattern.Liquidity of lower trend line is taken successfully and now after accumulation and manipulation BOME will distributes up to TP1, TP2 , TP3 and finally TP4.Move your SL to BE after TP1
Good Luck

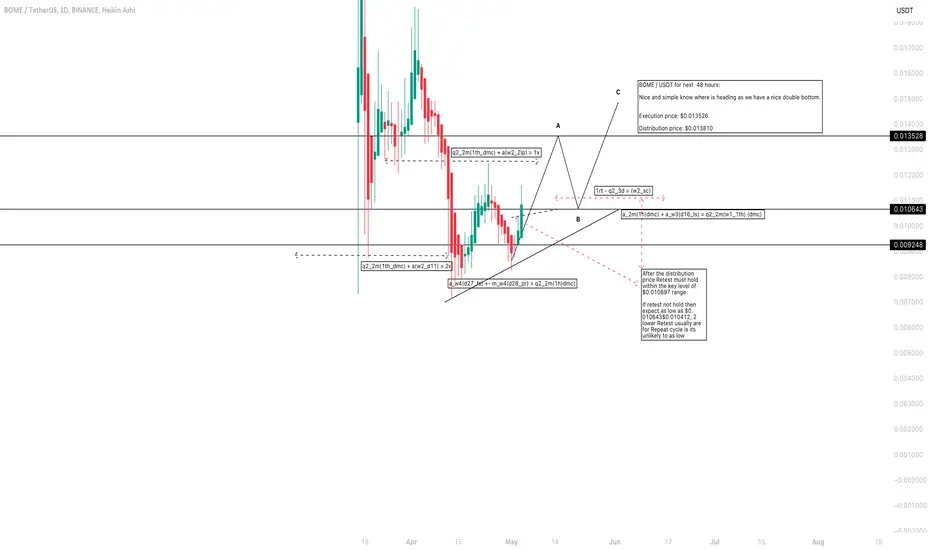
BOME / USDT for next 48 hours: BOME / USDT for next 48 hours:
Nice and simple know where is heading as we have a nice double bottom.
Execution price: $0.013526
Distribution price: $0.013810
Bome Vs Usd Buy Current Market 0.009400 As A Investor Bome Vs Usd Buy Current Market 0.009400 As A Investor
Bome Vs Usd Sell Target Point 0.24800 As A Investor

Bome Vs Usd Buy Current Market 0.009400 Target Sell Point 0.0142Bome Vs Usd
Buy Current Market 0.009400
Target Sell Point @ 0.012200 ,0.013200 , 0.14200
