Head and Shoulder PatternM_M looks broken head and shoulder pattern, 800 to 850 look good buy level for the target of 1200+
Let's see...
M_M trade ideas

M&M SCALPINGMm footprint order trigger
go long with defined risk
all levels shared for educational purpose only.we are not sebi registered

Mahindra and Mahindra intraday trade tomorrowIt should go long as it will take support from a fib level till the next fib level.
maybe we can get a intraday trade tomorrow for long and short, both.

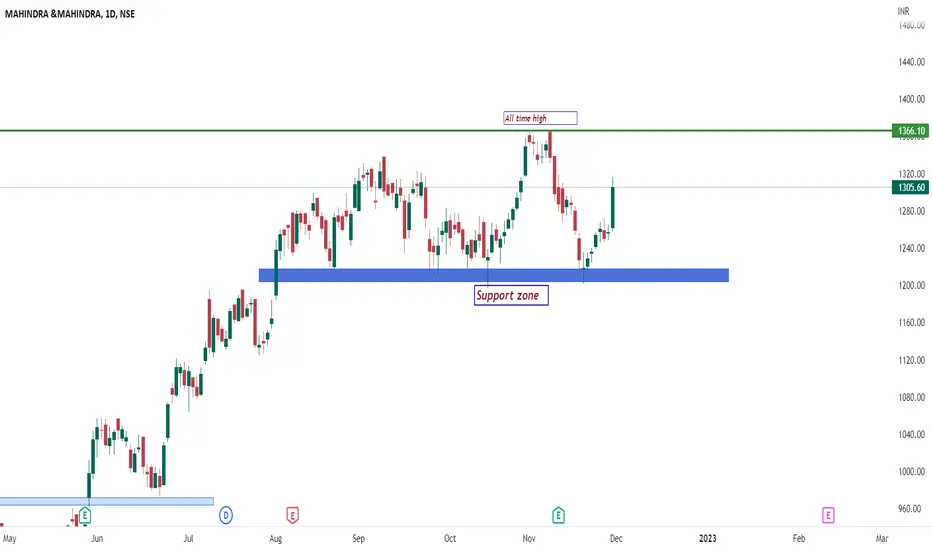
Mahindra and mahindraday chart of mahindra and mahindra in which strong support zone is 1210-1220 and resistance is all time high 1366 zone
mnm going downi feel it's a triple combo.
fib retracement at 60% level plus a trendline plus a divergence with a resistance level too.
It should retrace and the target of the next support zone should be achieved.
It should take it down to 80 points.

Mahindra and Mahindra chart analysis After seeing the chart and understanding the pattern,
I think that this is how m&m could work till mid December.
It will make a range of 20-25pts and then give a breakout and will reach till 1330 again.
There are also chances that it will give breakout downside but it won't fall much it will go like -30 to -50 pts after that

Mahindra & Mahindra - short term tradeBuy M&M @/above 1190
Intraday/Short term Target 1233
Stop Loss 1182
Profit approx. 4%

Mahindra & MahindraMahindra & Mahindra breaking out of consolidation range & facing multiple resistance level of 1280-1282 with very good volumes.
Could be bought with mentiond stoploss & targets.

M_M sell for intraday tradingM_M sell for intraday trading if stock break the given support level............

#M&M Cash : Looks good above 1315.10#M&M cash -Positional for 3-4 days
21.09.2022
Buy above 1315.10
Stoploss 1300
Target 1336-1340/1360
Cmp 1306.65

Strong buy for Long & Mid term investment Strong buy for Long & Mid term investment- Buy Levels 1115-1135

What mistakes we make with breakout What we do, we only see the breakouts happening, but miss to see the pattern or ladder it took for a breakout, and whether thats sustainable or not, we dont care and get trap again


Reversal from 52 Week highM&M showing signs of trend reversal here..
Signals -
1. RSI divergence
2. Overbought
3. Bearish Engulf Candle
Targets on the right in black.
This chart is for study/educational purpose only.
Please DYOR.
I won't be liable for any P/L made by using above chart.

MAHINDRA moving in a channelM&M moving inside a channel facing rejection at the top of the channel. If Nifty triggers selling 980 should be the optimum level for buyers to enter

Will Mahindra & Mahindra keep the uptrend?In the analysis of this stock we have noticed the format of two curves from September 2018 to February 2021 and from February 2021 to October 2021.
Until this period, we have a resistance at 956, and we have a huge drop of the stock due to the COVID phase but it was consolidated.
Then from March 2022 we notice a huge bullish trend, so to verify whether this will follow or not, we drew two trend lines and we opted for the Fibonacci Extensions in order to see at what point should we exit the trend.
What we can expect is that the price will reach the line at 1308 then will drop to follow the trend line and continues the raise

M&M.. top formed?M&M likely has formed a top
with an exhaustion gap and sell off after a gap up with heavy volumes
likely to correct to the channel lower end

M_M buy for intraday tradingM_M buy for intraday trading if stock break the given resistance zone ...........

M&MIf it opens below the marked area there is high probability that it will go down after retesting.
As nifty moving down!!

M&M .. cycle time study (learning)M&M has been moving in 30 day cycle inside the channel as shown
upmove roughly 19 days to the top of the channel, down move 11 days to the bottom of the channel
high of 1195 couldnt be crossed again and sold off even Nifty was strong
as per study 1195(SL) channel top and 1080 (target)channel bottom
looks the fall already begun today
1080 should be achieved by august 1st week
note: this is a study for reference. not a recommendation, please do your due diligence


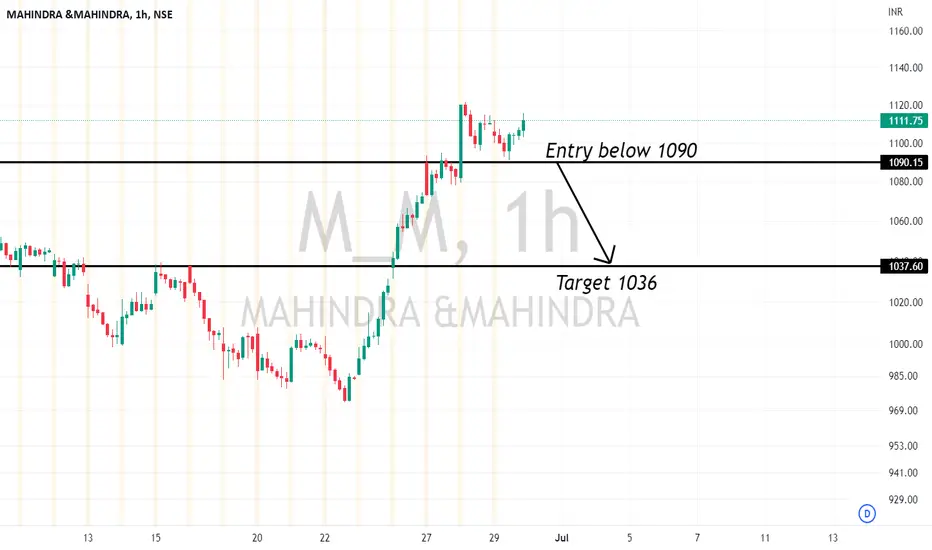
Mahindra & Mahindra Intraday View 30_06_2022Intraday View : - Bearish
Entry Below : - 1190
Target : - 1036